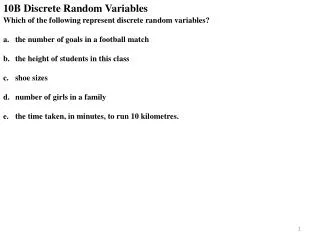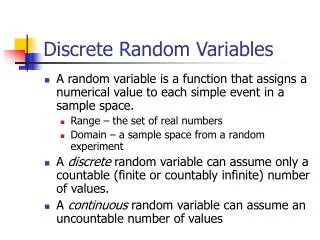
3-1 Discrete Random Variables
3-1 Discrete Random Variables. 3-1 Discrete Random Variables. Example 3-1. 3-2 Probability Distributions and Probability Mass Functions. Figure 3-1 Probability distribution for bits in error . 3-2 Probability Distributions and Probability Mass Functions.

3-1 Discrete Random Variables
E N D
Presentation Transcript
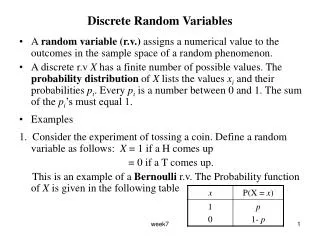
3-1 Discrete Random Variables Example 3-1
3-2 Probability Distributions and Probability Mass Functions Figure 3-1Probability distribution for bits in error.
3-2 Probability Distributions and Probability Mass Functions Figure 3-2Loadings at discrete points on a long, thin beam.
3-2 Probability Distributions and Probability Mass Functions Definition
3-3 Cumulative Distribution Functions Definition
Example 3-8 Figure 3-4Cumulative distribution function for Example 3-8.
3-4 Mean and Variance of a Discrete Random Variable Definition
3-4 Mean and Variance of a Discrete Random Variable Figure 3-5A probability distribution can be viewed as a loading with the mean equal to the balance point. Parts (a) and (b) illustrate equal means, but Part (a) illustrates a larger variance.
3-4 Mean and Variance of a Discrete Random Variable Figure 3-6The probability distribution illustrated in Parts (a) and (b) differ even though they have equal means and equal variances.
3-4 Mean and Variance of a Discrete Random Variable Expected Value of a Function of a Discrete Random Variable
Describing dataMeasures of Central Tendency and Dispersion. • I. What is a measure of Central Tendency? • Often a single number is needed to represent a set of data. • Arithmetic Mean or average
Describing dataMeasures of Central Tendency and Dispersion. • Define: Statistics • A measurable characteristic of a sample. • Define: Parameter • A measurable characteristic of a population • population mean.
Describing dataMeasures of Central Tendency and Dispersion. • Median: • properties of the Median. • Mode: • Define: ModeThe value of the observation that appears most frequently.
Why study Dispersion? • Remark: A measure of Central Tendency is representative if data are clustered close to it. • There are several reasons for analyzing the dispersion in a set of data.
Summarizing DataFrequency Distribution and Graphic Presentation • Goals: • Organize raw data into a frequency distribution. • Portray the frequency distribution in histogram a cumulative frequency. • Present data using such common graphic techniques: line charts, bar chats, and pie charts.
Frequency Distribution • Define: A grouping of data into categories showing the number of observation in each mutually exclusive category • Determining class interval: • Suggesting class interval = • A small value indicates that the data are clustered closely: The mean is a representative of the data set. The mean is a reliable average. • A large value means the mean is not reliable. • To compare the spread in two or more distribution.
Measures of dispersion • Range: • the difference between the highest value and lowest value. • Mean Deviation (MAD)
Mean Deviation (MAD) • Advantage and Disadvantage of MAD • Two advantages: • It uses the value of every item in a set of data • It's the mean amount by which the value deviate from the mean. • Disadvantage: • Absolute value are difficult to calculate
Measures of dispersion • Variance and Standard deviation. • Sample variance: • Sample Standard Deviation:
Box-Plots • A Box plot is a graphical display that gives us information about the location of certain points in a set of data as well as the shape of the distribution of the data.
Box-Plots • The Upper Inner Fence is: UIF = Q3 + 1.5 (IQR) • The Upper Outer Fence is: UOF = Q3 + 3.0 (IQR) • The Lower Inner Fence is: LIF = Q1 - 1.5 (IQR) • The Lower Outer Fence is: LOF = Q1 - 3.0 (IQR)
Box-Plots • The quartiles: • Consider a data set rearranged in ascending order. The quartiles are those views( Q1, Q2, Q3) that divide the data set into four equal parts.
Some useful formulas for calculating probabilities • Permutations • Fundamental Counting Principle • Combinations
3-5 Discrete Uniform Distribution Definition
3-5 Discrete Uniform Distribution Example 3-13
3-5 Discrete Uniform Distribution Figure 3-7Probability mass function for a discrete uniform random variable.
3-5 Discrete Uniform Distribution Mean and Variance
3-6 Binomial Distribution Random experiments and random variables
3-6 Binomial Distribution Random experiments and random variables
3-6 Binomial Distribution Definition
3-6 Binomial Distribution Figure 3-8Binomial distributions for selected values of n and p.
3-6 Binomial Distribution Example 3-18
3-6 Binomial Distribution Example 3-18
3-6 Binomial Distribution Definition
3-6 Binomial Distribution Example 3-19
3-7 Geometric and Negative Binomial Distributions Example 3-20
3-7 Geometric and Negative Binomial Distributions Definition