250
Supplemental Figure 1. A. D. 750. 750. 500. 500. serum PCSK9 (ng/ml). serum PCSK9 (ng/ml). 250. 250. 0. 0. 0. 10. 20. 30. 40. 50. 60. 70. 80. 90. 0. 0.5. 1. 1.5. 2. 2.5. 3. 3.5. 4. C. Triglycerides. LDL Cholesterol. F. 750. 750. 750. 500. serum PCSK9 (ng/ml).

250
E N D
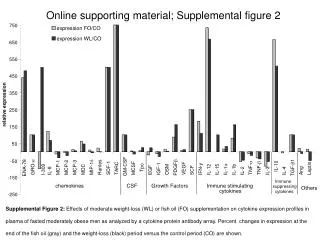
Presentation Transcript
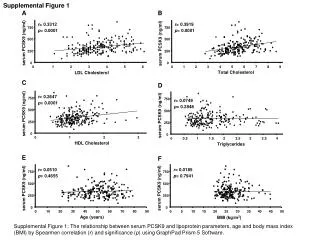
Supplemental Figure 1 A D 750 750 500 500 serum PCSK9 (ng/ml) serum PCSK9 (ng/ml) 250 250 0 0 0 10 20 30 40 50 60 70 80 90 0 0.5 1 1.5 2 2.5 3 3.5 4 C Triglycerides LDL Cholesterol F 750 750 750 500 serum PCSK9 (ng/ml) 500 500 serum PCSK9 (ng/ml) 250 250 250 0 0 1 2 3 0 0 HDL Cholesterol 0 1 2 3 4 5 6 0 5 10 15 20 25 30 35 40 45 50 BMI (kg/m2) E B 750 serum PCSK9 (ng/ml) 500 serum PCSK9 (ng/ml) 250 0 Age (years) 0 1 2 3 4 5 6 7 8 9 Total Cholesterol r= 0.3312 p< 0.0001 r= 0.3919 p< 0.0001 r= 0.2647 p= 0.0001 r= 0.0749 p= 0.2848 r= 0.0510 p= 0.4655 r= 0.0185 p= 0.7941 Supplemental Figure 1: The relationship between serum PCSK9 and lipoprotein parameters, age and body mass index (BMI) by Spearmen correlation (r) and significance (p) using GraphPad Prism 5 Software.