Download
1 / 22
220 likes | 393 Vues
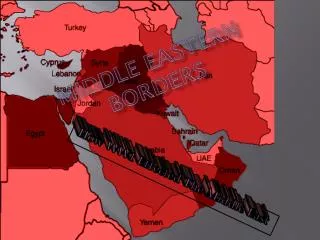
Risks In Middle Eastern Stock Markets. Shawkat M. Hammoudeh * Lebow College of Business Drexel University. Description of Arab Stock Markets. There are 11+ Lebanon active Arab stock markets. There are small and limited stock markets in Palestine, Syria, Iraq, Algeria, and Sudan.

E N D
Risks In Middle Eastern Stock Markets Shawkat M. Hammoudeh* Lebow College of Business Drexel University
Description of Arab Stock Markets • There are 11+ Lebanon active Arab stock markets. • There are small and limited stock markets in Palestine, Syria, Iraq, Algeria, and Sudan. • Among the 11 active stock markets, Saudi Arabia has by far the largest market capitalization, followed by that of the UAE. • In the UAE, Dubai and Abu Dhabi have separate markets, with the former having a greater market capitalization than the latter. • The Saudi market capitalization is greater than that of Turkey.
Characteristics of Arab Stock Markets • Arab markets are frontier markets and aspire to be emerging markets. • Qatar and Abu Dhabi are now being considered to be elevated to the emerging markets status. • Foreign ownership hinders the elevation to this status. • Turkey is an emerging market. • Most of the seven GCC markets are thinly traded and not highly liquid. • The GCC governments, particularly that of S. Arabia, own a sizable part of the markets. • The markets in Jordan, Egypt, Tunisia, and Morocco are more liquid than the GCC markets.
Research on the Arab Markets Price discovery function. Inter-market causal relationships: Volatility among the GCC markets. Herding in the GCC markets. Optimal portfolio weights and hedging. Systematic and systematic risks. There are strong causal relationship between the GCC markets but weaker ones with Jordan and Egypt. There are also strong relationships between Morocco and Tunisia. There ate not strong diversification benefits in portfolios that contain those markets
Research Results-I • Price discovery: Saudi Arabia has been found to be the leader. • Strong causal relationships between the GCC markets and between the markets in Tunisia and Morocco. • No strong diversification benefits in portfolios that contain most of the Arab countries. • After the real estate crisis in Dubai, research has found this emirate sending volatility shocks to the Saudi Market. • GCC markets has three market regimes: low, high and crash.
Research Results-II • Herding occurs mostly in the crash regimes. No herding in the low volatility regime. Fear of contagion among markets. • Order of transition between regimes: low, crash and high regimes. No warning sign. • Optimal portfolio weights favor banking and financial sectors over other sectors. • Hedging ratios in GCC sectors are lower than those in the United States. • Hedging is more effective in the GCC countries than in the United States.
Systematic and Systemic Risks Several systems can be used to measure market risks. These include volatility, beta systems, expected shortfall and systems expected shortfall (SES) models.
Systematic Risk: Beta Measures the beta in the CAPM model. This is the risk facing a financial institution relative to the overall market risk. It is time varying. For Kuwait’s financial equity sectors (banking, investment, real estate), systematic risk has been declining over time. For Kuwait, the beta system shows that the banking and real estate sectors have more systematic risk variations than the other sectors under considerations. More exposure to risk.
Systemic Risk: VaR and SES • Banks in the Middle East and North Africa (MENA) countries are strongly regulated and closely supervised. This works well in good times. How about bad times? • The recent global financial crisis has however revealed that risk assessment of a bank or a financial institution should not be limited to an isolated evaluation of bank's balance sheet or the institution’ portfolio composition. • Regulators should be aware of the banks’ and other lending institutions’ positions. • Regulators should also be aware of the models that financial institutions use to measure risks.
VaR and SES-Continued • The VaR is a popular approach because it provides a single quantity that summarizes the overall market risk faced by an institution. It summarizes the worst loss over a target horizon with a given level of confidence. • There are several models that can be used to estimate value at risk. The conventional models like RiskMetrics seem to be the most popular but they are the least accurate. • My research has shown that the accuracy of these different models changes with subperiods. Some of these market risk models may do well in forecasting risk for individual assets, while others do better for portfolios.
Need for a warning signal • There is a need for a system that anticipates a financial Institution’s propensity to undercapitalize when the whole financial system is experiencing capital shortage. • The systemic expected shortfall (SES) is the prominent system that the literature proposes in the case of capital shortage. • Several systems can be used to measure risks. These include volatility, beta systems, expected shortfall and systems expected shortfall.
SES: Superior Risk System • SES measures contribution of each institution to systems total risk in case of a financial distress. • It proves its superiority over volatility and beta models for Turkey. • A similar system has been applied to Turkey’s financial firms. • If Dubai has a risk-warning system like the SES, it would most likely have avoided its real estate crisis which had brought this fast growing emirate to the brink of bankruptcy.
Policy recommendation • All the stock markets in the Arab World are frontier markets, while in Turkey the stock market is an emerging models. • The diversification among these markets is poor. • There is a need for well diversified commodity market • There is a need for futures and options markets: diversification and hedging. • Banks should have risk models such as VaR to forecast risks on daily basis and monitor compliance with Basel rules. • Bank should use the model a warning system that gives a warning signals of risk in the near future.
I. Empirical Model: Volatilities • BEKK does not have a VAR attached to it because the BEKK VAR distribution has not theoretically been analyzed. • VAR-GARCH (Ling and McAleer, 2003) has advantages over the BEKK model. • Mean equation for the ith sector in this system is AR(1), and is given by: • where Ri,t is the return of the ith sector of the nx1 vector,D03 is the geopolitical dummy for the 2003 Iraq war and is an i.i.d. random shock, and is the conditional variance of the ith sector.
I.Empirical Model: Cont’d • The conditional variance equation of the ith sector (i=1, 2, 3) for each GCC market:
II.Empirical Model:Portfolio Design • A portfolio weight w12,t of holdings of two-equity sector indices (1 and 2) in the same market (Kroner and Ng,1998) is given by:
II.Empirical Model: Hedging • A long position of one dollar taken in one sector index in a given GCC stock market should be hedged by a short position of $btin another sector index in the same market. • The bt is given by: • where bt is the risk-minimizing hedge ratio for two sector indices
I. EmpiricalResults: Volatilities • Past own volatility and not past shock is the stronger driver in determining future volatility for the GCC frontier stock markets. Fundamentals matter more than news! • The Banking/Financial sector seems to be the least volatile among the sectors for most countries. • In S. Arabia and Kuwait, the most volatile sector is Service, in Qatar is the Industrial and in UAE is the Insurance.
EmpiricalResults: Volatilities (Cont’d) • Moderate volatility spillovers exist between the sectors within the individual countries, with the exception of Qatar which demonstrates strong spillovers. • Qatar has the strongest inter-sector volatility spillovers, followed by Kuwait and then Saudi Arabia. • Saudi stocks are particularly sensitive to political and military conflicts such as the 2003 war in Iraq.
II. EmpiricalResults: Weights & Hedging • Optimal portfolio weights suggest that investors own much more banking stocks than service or industrial stocks in Saudi Arabia and Qatar, and more financial stocks than service or insurance stocks in UAE in order to minimize risk. Investors in Kuwait should hold more industrial stocks. • The values for the hedge ratios for the GCC sectors are smaller than those for US equity sectors, reflecting the possibility of greater hedging effectiveness in GCC markets.