
Epidemiological Study Designs Overview: Types, Uses, Elements, and Hypotheses
E N D
Presentation Transcript
Study Design Simon Thornley
Overview • By the end of this lecture you will be able to • Describe the main types of analytical epidemiological studies • Describe when to use different designs for different research questions.
Participatory epidemiology • Epidemic of dental caries, we think sugary drinks may be responsible.... • Cohort/Cross-sectional study • Outcome • Filling, root canal or extraction due to caries (not wisdom tooth) in last 5 years • Exposure • At least one sugary soft drink per week?
Participatory epidemiology • Case – control study • Sample by outcome, rather than exposure. • Outcome – dental decay • Exposure – sugary soft drinks.
Epidemiological studies Analytic Descriptive • Aim • To assess the cause of a disease • Identify point for intervention, to either prevent disease occurring or improve prognosis of people with disease. • Aim • To assess the health status of the population • Used for time trends/planning health services. • To perform an accurate sample, you need a sampling frame • Surveys • Sample based (simple/cluster) • Capture-Recapture
Types of studies Observational Cohort Cross sectional Case control Experimental RCT Ideal study is RCT; all other studies are trying to emulate this design.
Elements of epidemiological study Participants Outcomes Exposures
Hypothesis • Usually that a certain exposure causes a disease • For example, perinatal sugar consumption causes childhood asthma • Ideally written explicitly before study started. • Hypotheses need to be stated in such a way so that they can be proven wrong • Analytical study tests hypothesis that exposure is associated with disease.
What are we doing in epidemiological studies? • What we want to know • Does sugar exposure cause asthma? • But we have limited resource..... • Among countries that took part in the ISAAC study is there an association between reported severe asthma symptoms in 6 year old children and average sugar disappearance data, collected six years before the children were surveyed?
Screening questions • Feasible • Interesting • Novel • Ethical • Relevant
In pictures... Truth in the universe Truth in the study Infer Error Target population Intended sample Design Intended variables Phenomena of interest
Analytical study design GATE frame (Prof. Rod Jackson) a b c d Time
A word about probability (risk) • A number between 0 (it won’t happen) and 1 (it definitely will happen) that describes the long run frequency of an outcome • What is the probability of rolling 1 on a six sided dice? • What about the probability of diarrhoea after eating contaminated sandwhiches?
Conditional probability • Risk of events after people are exposed (or not) represent “conditional probabilities”. • In all studies, we compare probabilities among exposed and unexposed • If exposure not related to outcome, then risk after being exposed (conditional prob) is the same as the risk for the total population (marginal prob.).
Conditional probability and effect measures • Effect measures (e.g. risk ratio, odds ratio, incidence rate ratio) compares the conditional probabilities in exposed and unexposed to see if they differ. • Is difference due to chance or not (effect of exposure)?
What does effect measure mean? • E.g. Relative risk = 2.98 (95% CI 0.98 to 4.95) • if 1, no difference. • if >1 then the exposure ↑ the probability of outcome • if <1, the exposure ↓ probability of outcome.
Participants Need to define and sample Ideal is to have similar population that differs only by exposure of interest Need sufficient heterogeneity of exposure Access Inclusion or exclusion criteria based on potential confounding factors
Exposure GATE frame assumes binary exposure In reality, often measured on continuous scale Need to check the accuracy of what is being measured Validity (agreement compared to gold standard) and reliability (same over time) Objective vs subjective measures Cotinine vs self reported smoking status
Outcome Seek outcome that is objective and easily measured Eg. Death, 1st cardiovascular disease event Objective vs subjective measurement Same outcome measured on all participants, regardless of exposure
Why favour one study over another? Randomised study ideal, but not always practical Ethical considerations – assigning smoking exposure? Resources Routinely collected data allows cheap observational studies to be done Hypothesis generating, may be sequential. Eg. Vitamin D and respiratory infection. Rarity/latency issues in choosing between case control and cohort design.
Randomised controlled trials Randomisation of treatment or prevention Confounding both known and unknown Blinding subject/investigator or both Ethics Not harmful treatments Intention to treat – ”analyse what you randomise”, even if subjects switch treatment during follow up
Randomised controlled trials Key point is allocation of exposure by investigator Random allocation a b c d
Measure of effect For binary outcome Cum. Incidence in exposed Relative risk = ------------------------------------------- Cum. Incidence in unexposed a/(a+b) = -------------- c/(c+d)
Randomised controlled trial Best design for assessing causation Random assignment of treatment results in balance of known and unknown risk factors into exposure groups (numbers large) Ethics – clinical equipoise Best for straight forward interventions (eg. Drugs) with blinding possible Different designs – separate arms, crossover, factorial.
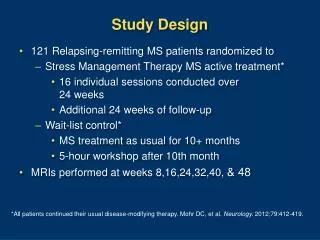
Does pre-quit nicotine treatment improve quitting? Smoking cessation therapy Schuurmans MM, Andreas HD, Xandra van B, et al. Effect of pre-treatment with nicotine patch on withdrawal symptoms and abstinence rates in smokers subsequently quitting with the nicotine patch: a randomized controlled trial. Addiction. 2004;99(5):634-40. Quit Smoking Pre-quit NRT 18 62 Adult smokers 8 80 Placebo NRT
Does pre-quit nicotine treatment improve quitting? Incidence in exposed Relative risk = ---------------------------- Incidence in unexposed 18/(18+62) = -------------- = 2.5 8/(8+80)
Cohort By measurement
Cohort study eg Framingham Patients without disease Group by exposure Can use a variety of exposures Follow until disease develops
Cohort advantages Exposure precedes disease Disease status does not influence selection Several outcomes possible Good for rare exposures
Cohort disadvantages Prospective costly Inefficient for rare diseases with long latency Several outcomes possible Exposed followed more closely than unexposed? Loss to follow up causes bias
Do computer screens cause spontaneous abortions? 1991 abortion No abortion Computer screens Female telephone operators 54 312 82 434 No computers Time
Do computer screens cause spontaneous abortions? Incidence in exposed Relative risk = ---------------------------- Incidence in unexposed 54/(54+312) = ------------------- = 0.93 82/(82+434)
Cross sectional Participants sampled at one point or short duration Exposures and outcomes assessed at same point in time By measurement
Cross-sectional Advantages Describes pattern of disease Variety of outcomes and exposures Cheap Inexpensive Disadvantages Prevalent rather than incident cases Can not distinguish cause and effect Must survive long enough to be included in study Short duration diseases under-represented (e.g. Influenza)
Cross-Sectional study - bias Imagine... People with disease that are sedentary die early Cross-sectional study of disease (outcome) and exercise (exposure) Only sample survivors, so find high proportion of people who exercise with disease What would you infer about causal relationships?
Does wearing fluoro gear protect you from bike crashes? Bike crash No bike crash Cyclists Taupo bike race Fluoro colours 162 323 1343 588 No fluoro colours
Do computer screens cause spontaneous abortions? Cum. Incidence in exposed Relative risk = ---------------------------- Cum. Incidence in unexposed 162/(162+323) = ------------------- = 1.10 588/(588+1343)
Case control Investigator selects cases and controls based on disease status Carefully defined population (cases = control population Exposure history examined
CC - advantages Good for long latency/ rare diseases Evaluate variety of exposures Smaller sample size
CC - disadvantages Can't study several diseases Can't estimate disease risk, because work backwards from disease to exposure* More susceptible to selection bias as exposure already occurred. More susceptible to information bias Not efficient for rare exposures
Case control study Incident vs Prevalent cases Incident cases from population registry Prevalent – people with disease at particular point in time Incident – exposure and disease tied only to development of disease, not duration or prognosis. Prevalent – selection bias/favours long lived, chronic cases