Download
1 / 23
280 likes | 736 Vues
MESB 374 - 9 System Modeling and Analysis FREQUENCY DOMAIN ANALYSIS Frequency Response. Frequency Response. Forced Responses to Sinusoidal Inputs Transient and Steady-State Response Frequency Response Steady-State Response to sinusoidal inputs at various input frequencies Bode Plots

E N D
MESB 374 - 9 System Modeling and AnalysisFREQUENCY DOMAIN ANALYSISFrequency Response
Frequency Response • Forced Responses to Sinusoidal Inputs • Transient and Steady-State Response • Frequency Response • Steady-State Response to sinusoidal inputs at various input frequencies • Bode Plots • A convenient graphic display of frequency response at all input frequencies
Forced Response to Sinusoidal Inputs Ex: Let’s find the forced response of a stable first order system: to a sinusoidal input: • Forced response in s-domain: • PFE: • Use ILT to obtain forced response in time-domain:
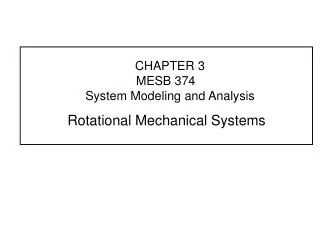
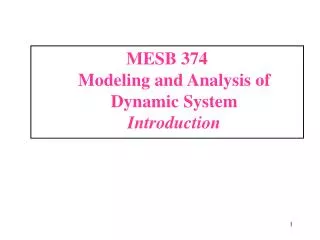
2 1.5 1 0.5 0 -0.5 Response -1 -1.5 -2 0 2 4 6 8 10 12 14 Time (sec) Forced Response to Sinusoidal Inputs Input is sin(2t) Output Input
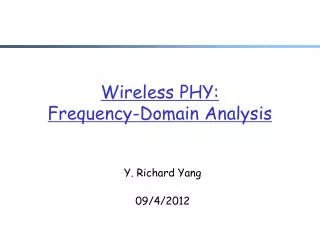
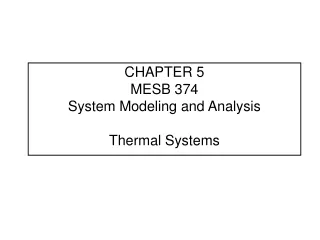
Forced Response to Sinusoidal Inputs In-class Ex:Given the same system as in the previous example, find the forced response to u(t) = sin(10 t).
1 0.8 0.6 0.4 0.2 Response 0 -0.2 -0.4 -0.6 -0.8 -1 0 0.5 1 1.5 2 2.5 3 3.5 4 4.5 5 Time (sec) Forced Response to Sinusoidal Inputs Input is sin(10t) Output Input Transient
Forced Response to Sinusoidal Inputs Ex:Let’s revisit the same example where and the input is a general sinusoidal input: sin(w t). • Use the residue formula to find Ai’s:
Forced Response to Sinusoidal Inputs Ex: Forced response in time-domain: The steady state sinusoidal response in time-domain: Stable LTI System Sinusoidal input Sinusoidal output Phase shift Changed Magnitude What happens to frequency? No Change! where
Frequency Response Frequency responseis used to study the steady state output ySS(t) of a stable LTI system to sinusoidal inputs at different frequencies. In general, given a stable system: If the input is a sinusoidal signal with frequency w , i.e. then the steady state output ySS(t) is also a sinusoidal signal with the same frequency as the input signal but with different magnitude and phase: where G(jw) is the complex number obtained by substitute jw for s in G(s) , i.e.
u 2p/w t Frequency Response LTI System G(s) Input u(t) U(s) Output y(t) Y(s) ySS 2p/w t • A different perspective of the role of the transfer function:
Frequency Response G Sinusoidal Input u(t) Steady-state Sinusoidal Output y(t) G
Ex:1st Order System The motion of a piston in a cylinder can be modeled by a 1st order system with force as input and piston velocity as output: The EOM is: (1) Let M = 0.1kg and B = 0.5 N/(m/s), find the transfer function of the system: (2) Calculate the steady state output of the system when the input is In Class Exercise f(t) 0)=0 2 (-63.4349)) 0.8944 v (-75.9638)) 0.4851 (-80.5377)) 0.3288 (-82.8750)) 0.2481 (-84.2894)) 0.1990 0.1661 (-85.2364))
In Class Exercise (3) Plot the frequency response plot
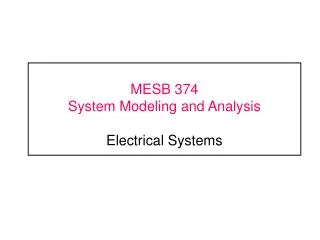
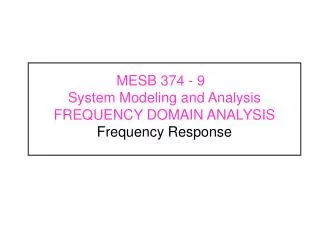
Let M1 = 10 kg, K1 = 1000 N/m, B1 = 4 N/(m/s).Find the steady state response of the system for f(t) = (a) sin(8.5t) (b) sin(10t) (c) sin(11.7t). Without vibration absorber: EOM: TF (from f(t) to z1): z1 M1 K1 B1 f(t) Example - Vibration Absorber (I) (-6.9852)) 0.0036 (-90.000)) 0.025 (-172.7699)) 0.0027
f(t) = sin(8.5 t) 0.01 0.005 (m) 0 z1 -0.005 f(t) = sin(10 t) -0.01 0.04 0.02 (m) 0 z1 -0.02 f(t) = sin(11.7 t) -0.04 0.005 (m) 0 z1 Time (sec) -0.005 0 5 10 15 20 25 30 35 40 45 50 Example - Vibration Absorber (I) Poles:
With vibration absorber: EOM: TF (from f(t) to z1): Let M1 = 10 kg, K1 = 1000 N/m, B1 = 4 N/(m/s), M2 = 1 kg, K2 = 100 N/m, and B2 = 0.1 N/(m/s). Find the steady state response of the system for f(t) = (a) sin(8.5t) (b) sin(10t) (c) sin(11.7t). z2 M2 K2 B2 z1 M1 K1 B1 f(t) Example - Vibration Absorber (II) 0.023 (-66.5)) 0.001 (-90)) 0.016 (-88.5))
f(t) = sin(8.5 t) 0.04 0.02 (m) 0 z1 -0.02 f(t) = sin(10 t) -0.04 0.004 0.002 (m) z1 0 -0.002 f(t) = sin(11.7 t) -0.004 0.02 0.01 (m) 0 z1 -0.01 -0.02 Time (sec) 0 5 10 15 20 25 30 35 40 45 50 Example - Vibration Absorber (II)
Example - Vibration Absorber (II) Characterizing Transient Response: The characteristic equation Q1: Can you make a good guess of the duration of the transient period? Q2: Can you explain the observed steady-state sinusoidal responses? If the frequency of input is near the imaginary part of one of poles, resonance will possibly happen. If the frequency of input is near the imaginary part of one of zeros, the effect of input will probably be “absorbed”.
Frequency Response Plot No absorber added Frequency Response Plot Absorber tuned at 10 rad/sec 0.025 0.025 0.02 0.02 0.015 0.015 Magnitude (m/N) Magnitude (m/N) 0.01 0.01 0.005 0.005 0 0 0 2 4 6 8 10 12 14 16 18 20 0 2 4 6 8 10 12 14 16 18 20 Frequency (rad/sec) Frequency (rad/sec) 0 0 -45 -45 -90 -90 Phase (deg) Phase (deg) -135 -135 -180 -180 0 2 4 6 8 10 12 14 16 18 20 0 2 4 6 8 10 12 14 16 18 20 Frequency (rad/sec) Frequency (rad/sec) Example - Vibration Absorbers
Bode Plot No absorber added Bode Plot Absorber tuned at 10 rad/sec -30 -30 -40 -40 -50 -50 -60 -60 -70 -70 -80 -80 -90 -90 Phase (deg); Magnitude (dB) Phase (deg); Magnitude (dB) -100 -100 0 0 -45 -45 -90 -90 -135 -180 -135 -180 Frequency (rad/sec) Frequency (rad/sec) 0 2 2 1 1 0 10 10 10 10 10 10 Example - Vibration Absorbers A better way to graphically display Frequency Response !
M Example -- SDOF Suspension • Simplified Schematic (neglecting tire model) • Suspension System How does the traveling speed influence the magnitude of joggling? Car body z K B Suspension v Wheel Ap xp Reference L
Example -- SDOF Suspension Find: Given: How does the traveling speed influence the magnitude of joggling All parameters are normalized