9. Frequency Response
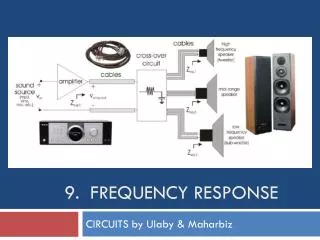
9. Frequency Response. CIRCUITS by Ulaby & Maharbiz. Overview. Transfer Function. Transfer function of a circuit or system describes the output response to an input excitation as a function of the angular frequency ω. Other Transfer Functions. Voltage Gain. Magnitude Phase.

9. Frequency Response
E N D
Presentation Transcript
9. Frequency Response CIRCUITS by Ulaby & Maharbiz
Transfer Function Transfer function of a circuit or system describes the output response to an input excitation as a function of the angular frequency ω. Other Transfer Functions Voltage Gain Magnitude Phase
RC Low Pass To determine corner frequency:
Filter Terminology Zin1= R + jωL. Im [Zin1] = 0 when ω = 0 Im [Zin2] = 0 requires that ZL = −ZC or, equivalently, ω2 = 1/LC
Scaling Scaling is used to configure a prototype version of the intended practical scaled circuit such that in the prototype circuit, element values are on the order of ohms, henrys and farads.
RL Filter --Magnitude Log scale for ω and dB scale for M
RL Filter--Phase Log scale for ω and linear scale for φ(ω)
Bode Plots: Straight line approximations Bode Magnitude Slope= 20N dB per decade Bode Phase Slope= 45N degrees per decade 1 decade 1 decade
Bode Plots Bode Magnitude Slope= 40dB per decade Bode Phase Slope= 90 degrees per decade
Example 9-4: Bode Plots Standard form Numerator: simple zero of second order with corner frequency 5 rad/s Denominator: pole @ origin, and simple pole with corner frequency 50 rad/s
Bandpass RLC Filter (cont.) Quality Factor Q: characterizes degree of selectivity of a circuit where Wstoris the maximum energy that can be stored in the circuit at resonance (ω = ω0), and Wdissis the energy dissipated by the circuit during a single period T.
Bandpass RLC Filter (cont.) • Derivation of Q Resonant frequency Bandwidth
Highpass Filter Lowpass Filter
Superheterodyne receiver Frequency of received signal is “down-converted” to a lower intermediate frequency, while retaining the modulation ( which contains the message information) intact
Tech Brief 17: Bandwidth and Data Rate Signal-to-noise ratio
Tech Brief: Bandwidth and Data Rate Shannon-Hartley Theorem Channel capacity (data rate) in bits/s Bandwidth in Hz Note: A high data rate can be achieved even if the signal power is smaller than the noise, so long as sufficient bandwidth is available.