Water Quality Factors and Their Impacts on Aquatic Life
Learn how factors such as temperature, dissolved oxygen, pH, nitrogen, phosphates, and turbidity affect water quality and aquatic organisms. Discover causes of pollution and ways to improve water health.

Water Quality Factors and Their Impacts on Aquatic Life
E N D
Presentation Transcript
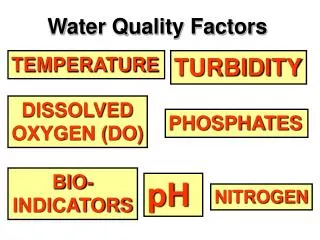
Water Quality Factors TEMPERATURE TURBIDITY DISSOLVED OXYGEN (DO) PHOSPHATES BIO- INDICATORS pH NITROGEN
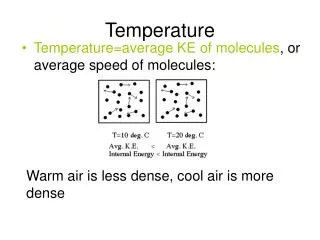
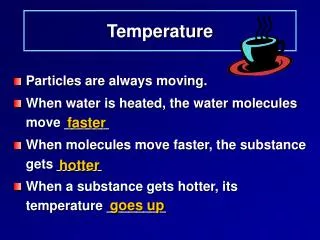
TEMPERATURE EFFECTS: changes rate of photosynthesis changes rate of respiration changes DO in water cold water holds more DO hot water holds less DO changes sensitivity of organisms to toxic waste, parasites, disease.
TEMPERATURE • Thermal pollution = adding warm water to cold water. CAUSES OF THERMAL POLLUTION: • Industry (nuclear power plants, paper mills) • Urban Development (storm water runoff, construction, soil erosion)
DISSOLVED OXYGEN (DO) ORANGE = Oxygen MICKEY MOUSE = Water Less Oxygen = Less fish Fish need Oxygen
DISSOLVED OXYGEN (DO) TO INCREASE DO: • Much of DO comes from atmosphere • Some of DO comes from photosynthesis TO DECREASE DO: • Add pollution • Add organic waste
ORGANIC WASTE = LOW DO • Organic waste = parts of once living things EXAMPLES OF ORGANIC WASTE: Sewage Farm runoff Discharge from food processing plants
HOW RAW SEWAGE LOWERS DO RAW SEWAGE GOES INTO WATER: • Decomposers chow down • Decomposers take up oxygen • Decomposers reproduce, taking up more oxygen • No more oxygen for other animals • Nothing left but decomposer & sewage-filled water.
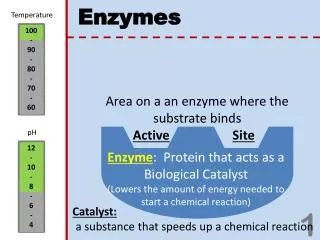
pH • pH = measure of concentration of hydrogen ions in a substance • Tells whether substance is: ACID BASE NEUTRAL
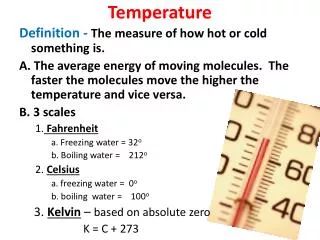
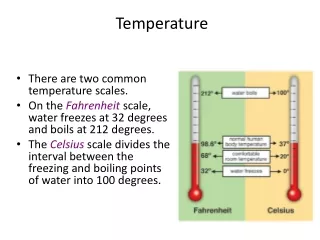
pH Measured on scale from 0 to 14 0 = highly acidic (HCl) 7 = neutral (pure water) 14 = highly basic (bleach) Seawater pH ranges from 7.5 – 8.5 Average pH of ocean water = 7.8 pH of natural water = 6.5 – 8.5 Optimal range for life = 6.5 – 8.2
pH US Northeastern rain pH = 4.3 Rain elsewhere in US pH = 5.0 – 5.6
pH SOURCES OF LOW pH IN WATER: • Acid rain is cause of acid in thousands of lakes • Burning fossil fuels has increased acid rain EFFECTS OF LOW pH IN WATER: • Low pH directly kills fish • pH < 5, most fish eggs die
NITROGEN • Living organisms need nitrogen to make proteins • Nitrates (NO3) & Nitrites (NO2) are compounds made of nitrogen & oxygen • Some nitrogen in water is good • The wrong amount is bad
NITROGEN SOURCES OF NITROGEN IN WATER: Human & animal waste fertilizer EFFECTS OF TOO MUCH NITROGEN: Lowers dissolved oxygen (DO).
NITROGEN – EUTROPHICATION Q: How does Nitrogen reduce the amount of DO? A: Eutrophication • Nitrogen feeds algae (green stuff) • Algae grows & grows • Algae blocks sunlight • Underwater plants die • Algae die and decompose • The decomposition takes up oxygen • No DO for organisms, so they die
NITROGEN OUR HAPPY POND IS NOW “DEAD”
PHOSPHATES • Phosphorus is an element like hydrogen or oxygen • Phosphorus combines with other things to make phosphates • Essential for living things • Usually present in very small amounts • Too much is bad
PHOSPHATES SOURCES OF PHOSPHATES IN WATER: Storm sewer runoff Soil erosion Fertilizer Forest fires Volcanic eruptions
PHOSPHATES EFFECTS OF PHOSPHATES: Eutrophication (same as with nitrates)
PHOSPHATES OUR HAPPY POND IS NOW “DEAD”
Measures clearness of water Murky water = greater turbidity Caused by solids blocking sunlight Measured using a Secchi disk or turbidity meter TURBIDITY
HUMAN DUMPING: Clay Silt Industrial waste Raw sewage SOURCES: Human dumping Construction Soil erosion Nitrate pollution Phosphate pollution TURBIDITY
TURBIDITY EFFECTS: Clogs fish gills Smothers eggs Makes water unlivable
BIO-INDICATORS • Bio-indicators = organisms that help determine health of water. • Presence or absence tells something about the water. • Not always an accurate way to measure water quality. • Accurate in telling environmental stress
HOW HUMANS AFFECT BIO-INDICATORS: Over-fishing Industrial pollution Poor farming practices Adding foreign species BIO-INDICATORS