Download
1 / 37
370 likes | 472 Vues
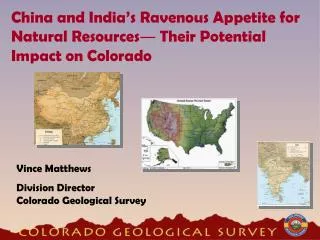
How does China matter? Water, Other things and its Impact on the Rest of the World. Northern China’s Water Shortage. Falling Supply Rapidly falling groundwater levels Historically low surface supplies Rising Demand Urban and Industrial Agricultural. “ Saving Water, Saves Lives ”.

E N D
How does China matter?Water, Other things and its Impact on the Rest of the World
Northern China’s Water Shortage • Falling Supply • Rapidly falling groundwater levels • Historically low surface supplies • Rising Demand • Urban and Industrial • Agricultural “Saving Water, Saves Lives”
Changing Trends in Water use 1978 • Nationally: more and more water being allocated to urban and industrial uses • National policy: Water use priorities Urban residential Industry Rural residential Irrigation (is last) 2001
Hai River Basin Surface Water Flows – 1980 to 2003 Billions meter3 Between 1985 and 1995, the Yellow River had between 30 to 180 days of flow interruptions in the lower reaches of the basin
Increase of Groundwater Irrigation in China Percent of Irrigated Area, Irrigated by Groundwater in Northern China
Increase of Tubewells in China Millions C B A A = number of wells reported in MWR statistical yearbook B = number of tubewells in India C = number of tubewells in the Rest of the World, including India
Data set 1 – collected by CCAP and University of California, Davis 2004 North China Water Resource Survey (NCWRS): 400 communities; 50 counties, 6 provinces National Representative (of North China) Inner Mongolia Liaoning Shanxi Hebei Henan Shaanxi
I. Characteristics of Aquifer • Types of aquifers: • Most pumping from shallow Depth to Water in GW Using Villages .04 .03 .02 .01 0 Estimated Density ~% of villages Average depth 2004: 28 m Average depth 1995: 21 m Depth (m): 0 50 100 150 1995 2004
Groundwater Levels are Falling, but varies across Northern China Change in Average Water Level 1995-2004 • Increased: 16% • No Change: 18% • Decreased < ¼ m/year 17% • Decreasing ¼ to 1/5 m/year: 40% • Decreasing > 1.5 m/year: 8% 52%
There are problems but not everywhere …of course, in some places, the problems are serious … Where there is a problem, is there a response by the government?
Water Law and Policies of MWR • Wells drilled by permit only • Regulation on pump spacing • In areas that are “seriously over-extracted,” control volume of pumping • Water extraction fee can be assessed • Control price of water charged by farmers that sell water • Moving towards pricing policies Less than 5% of villages Less than 7% of villages 2 out of 400 villages Zero Less than 10% actually try to control price Not very fast
Response by farmers? Elasticity of response is low: 0.3 to 0.4 … this means to get a large response, need to double the price of water … 75% of farmers would lose money at current prices
Farmers’ response at the intensive margin: Reduction in water use per unit of land Why so much water savings? Changes on the “extensive margin” [i.e., high water users, abandon farming”.
Farmer’s response at the extensive margin: Changing cropping pattern
Summary • In many places there is a water problem … • It is very difficult to regulate … • Price policy will work (tax electricity / diesel) … but there will be equity issues AND food security … • What happens to China’s food economy … in a rapidly growing / free trade world?
Nominal Protection Rates (NPR) for cereal and soybean (Pd-Pw)/Pw x 100
Agri. Trade Balance by Factor Intensity (mil US$) Labor intensive (competitive): Fruits; vegetables; livestock and aquaculture commodities Net Exports US Dollars, Billions exports imports Land intensive (uncompetitive): Grains; Oilseeds; Fiber; Hides; Sugar; Milk Powder; etc.
Rise of Supermarkets: Increasing Store Units Number of Stores 20 to 30 percent annual growth between 1998 and 2002
Producer response: Increasing Sown Areas of Vegetablesin ChinaandCalifornia(1000 ha) China California Every 2 years, + 1 California
Trends of Cultivated Areas of Fruits and Nuts inChina and California(1000 ha) China California Campaign to upgrade quality
Selection of sample towns 10 times (once for each of 10 wedges making up the circle) 36o x x x x x x x x x x x x x x x x x x x x x x x x x 40 x x x Total Town Sample Size: 5 circles x 10 towns per circle = 50 towns (or Nt = 50) x x x x x x x x x 60 x x x x x x 80 x x x 100 x x x 140 x Also need to get populations of ALL towns in each strata – for weighting
Where are they being grown?Inside Ring / Outside Ring 140 Share of Cultivate Area “Mostly here” 40 Area / Village (acres) These figures for vegetables in 2000 / same for F&N’s
Who are growing them?Rich or Poor? Share of Cultivate Area • Per capita income: • “Rich” -- $7.28/day • Poor -- $1.25/day • Fruits / Nuts / Vegetables are being increasing grown by poor farmers in relatively remote communities! Area / Village (acres) “They do” These figures for vegetables in 2000/ same for F&N’s
Domestic policy interventions Trade liberalization: GTAP CAPSiM Aggregate impacts: by commodity at national level Based on 80,000 household, disaggregated hh dataset Price transmission models Impacts by region: Production Consumption Income …. Impacts on poor/richer: Production Consumption Income ....
Impacts of China’s Trade Liberalization:Chang in agricultural production between 2005 and 2010 (compared with baseline, %) % of production Competitive commodities Uncompetitive commodities
Self-sufficient levels (%) of food, feed and fiber Uncompetitive: Feed grains, oilseeds, fiber
Self-sufficient levels (%) of food, feed and fiber“Will China Starve the World?” Food grains
Self-sufficient levels (%) of food, feed and fiber Competitive: Fruits / vegetables and processed foods
Impacts of WTO on agri. output for average farm by province in China, 2005 (%) losers lose Although on average agricultural sector is a winner, there are regional impacts winners gain
WTO对各地区化肥施用量的影响,%,2005年Impacts on fertilizer use in 2005, %
WTO对各地区农药施用量的影响,%,2005年Impacts on pesticide use in 2005, %
Baseline: Percentage of China’s net export in world total export in 2001 and 2020
Impacts of high GDP growth scenario: Welfare change (%) in different regions in 2020
Final Word • In worrying about number 1, 2 and 3 countries … • China matters … • In the case of China, itself … • and in the case of its impact on the rest of the world …