Download
1 / 17
270 likes | 855 Vues
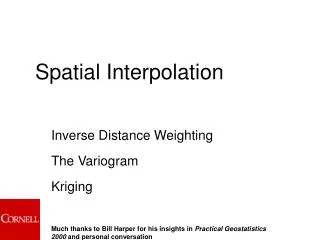
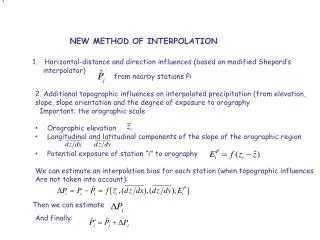
Spatial Interpolation of monthly precipitation by Kriging method. semivariance. sill. nugget. distance. range. Kriging method. Kriging is one of the spatial interpolation algorithm and falls within the field of geostatistics.

E N D
Spatial Interpolation of monthly precipitation by Kriging method
semivariance sill nugget distance range Kriging method • Kriging is one of the spatial interpolation algorithm and falls within the field of geostatistics. • Kriging is known to be more realistic spatial behavior of the climate variables. • Semivariogram - The fundamental tool of kriging - This concept explains how quickly spatial autocorrelation falls off with increasing distance.
Types of Kriging • Ordinary kriging - uses a random function model of spatial correlation to calculated a weighted linear combination of the available samples to predict the response for an unmeasured location. • Simple kriging • Universal kriging • Cokriging
Kriging analysis example • Compare Kriging method with and without considering elevation as a trend. • Find the best Kriging model in semivariogram. • Choose the best method and do spatial interpolation of monthly precipitation: 45 COOP stations from 1968 to 2007. • Produce 1km resolution spatially interpolated precipitation map for each time step. • Calculate the mean precipitation of each month in Yadkin river basin
Study Area: Yadkin River Basin • Location: western NC • Area: 17,775 km2 • Dataset for analysis : monthly scale data from 1968 to 2007 1) precipitation: approximately 45 COOP stations around Yadkin river basin area 2) stream discharge: USGS # 0212999
Kriging trend: Elevation • The relationship between elevation (m) and annual precipitation (mm) • 45COOP stations • Period: 1968~2007 • Positive precipitation trend with elevation
Semivariogram with trend • "ML“:Maximum Likelihood • "REML“: Restricted Maximum Likelihood parameter estimation • “ML matern” is the best fitted correlation function for both jan00 and feb00 (with the lowest AIC and maximum likelihood value).
Kriging method comparison (1) semivariogram • Without topographic trend • “Power” Model • With topographic trend • “ML Matern” Model
Kriging method comparison (2) visualization (1km resolution) w/o trend -Mean: 122.69, SD:33.27 With trend -Mean: 121.99, SD: 34.32
Kriging method comparison (3) error analysis Comparison between observed precipitation and interpolated precipitation
Kriging result example (1) Interpolation of monthly precipitation of 1998 using Ordinary Kringing with trend
Kriging result example (2) Jul. 1975 -The most spatially heterogeneous - Mean: 204.76 - SD: 82.71 Oct. 2000 - The most spatially homogeneous - Mean: 0.30 - SD: 0.22
Kriging error analysis (1) • Step 1: Monthly interpolations are sampled at the location of each precipitation stations. • Step 3: Aggregate monthly data to annual scale both observed and interpolated data. • Step 4: Linear regression between observed and interpolated data.
Monthly precipitation in Yadkin river basin (1968~2007) - Mean value of interpolated precipitation data • Standard deviation of precipitation within basin : 0.22 ~ 82.71
Conclusion • Kriging interpolation considering elevation as a trend is better fitted than without trend method. • Ordinary Kringing with elevation as a trend produces spatially well interpolated precipitation data. • The interpolated precipitation data by this method can be useful input data for hydrologic modeling, especially distributed model.