Download
1 / 45
500 likes | 958 Vues
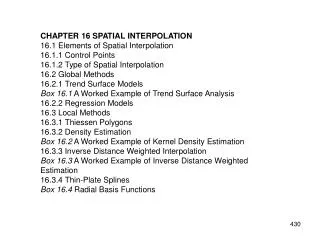
CHAPTER 16 SPATIAL INTERPOLATION 16.1 Elements of Spatial Interpolation 16.1.1 Control Points 16.1.2 Type of Spatial Interpolation 16.2 Global Methods 16.2.1 Trend Surface Models Box 16.1 A Worked Example of Trend Surface Analysis 16.2.2 Regression Models 16.3 Local Methods

E N D
CHAPTER 16 SPATIAL INTERPOLATION 16.1 Elements of Spatial Interpolation 16.1.1 Control Points 16.1.2 Type of Spatial Interpolation 16.2 Global Methods 16.2.1 Trend Surface Models Box 16.1 A Worked Example of Trend Surface Analysis 16.2.2 Regression Models 16.3 Local Methods 16.3.1 Thiessen Polygons 16.3.2 Density Estimation Box 16.2 A Worked Example of Kernel Density Estimation 16.3.3 Inverse Distance Weighted Interpolation Box 16.3 A Worked Example of Inverse Distance Weighted Estimation 16.3.4 Thin-Plate Splines Box 16.4 Radial Basis Functions
Box 16.5 A Worked Example of Thin-Plate Splines with Tension 16.4 Kriging 16.4.1 Semivariogram 16.4.2 Models 16.4.3 Ordinary Kriging Box 16.6 A Worked Example of Ordinary Kriging Estimation 16.4.4 Universal Kriging Box 16.7 A Worked Example of Universal Kriging Estimation 16.4.5 Other Kriging Methods 16.5 Comparison of Spatial Interpolation Methods Box 16.8 Spatial Interpolation Using ArcGIS Key Concepts and Terms Review Questions Applications: Spatial Interpolation Task 1: Use Trend Surface Model for Interpolation Task 2: Use Kernel Density Estimation Method Task 3: Use IDW for Interpolation Task 4: Use Ordinary Kriging for Interpolation Task 5: Use Universal Kriging for Interpolation Challenge Question References
Spatial Interpolation • Spatial interpolationis the process of using points with known values to estimate values at other points. • In GIS applications, spatial interpolation is typically applied to a raster with estimates made for all cells. Spatial interpolation is therefore a means of creating surface data from sample points.
Control Points • Control Pointsare points with known values. They provide the data necessary for the development of an interpolator for spatial interpolation. • The number and distribution of control points can greatly influence the accuracy of spatial interpolation.
Figure 16.1 A map of 175 weather stations in and around Idaho.
Type of Spatial Interpolation • Spatial interpolation can be global or local. • Spatial interpolation can be exact or inexact. • Spatial interpolation can be deterministic or stochastic.
Figure 16.2 Exact interpolation (a) and inexact interpolation (b).
Figure 16.3 Estimation of the unknown value at Point 0 from five surrounding known points.
*Given some required assumptions, trend surface analysis can be treated as a special case of regression analysis and thus a stochastic method (Griffith and Amrhein 1991). Table 16.1 A classification of spatial interpolation methods
Global Methods • Trend surface analysis, an inexact interpolation method, approximates points with known values with a polynomial equation. • A regression modelrelates a dependent variable to a number of independent variables in a linear equation (an interpolator), which can then be used for prediction or estimation.
Figure 16.4 An isohyet map from a third-order trend surface model.
Local Methods Because local interpolation uses a sample of known points, it is important to know how many known points to use, and how to search for those known points.
Figure 16.5 Three search methods for sample points: (a) find the closest points to the point to be estimated, (b) find points within a radius, and (c) find points within each quadrant.
Thiessen Polygons Thiessen polygonsassume that any point within a polygon is closer to the polygon’s known point than any other known points.
Figure 16.6 Thiessen polygons (in thicker lines) are interpolated from the known points and the Delaunay triangulation (in thinner lines).
Density Estimation • Density estimationmeasures cell densities in a raster by using a sample of known points. • There are simple and kernel density estimation methods.
Figure 16.7 Deer sightings per hectare calculated by the simple density estimation method.
Figure 16.8 A kernel function, which represents a probability density function, looks like a “bump” above a grid.
Figure 16.9 Deer sightings per hectare calculated by the kernel estimation method.. The letter X marks the cell, which is used as an example in Box 16.2.
Inverse Distance Weighted Interpolation Inverse distance weighted (IDW) interpolationis an exact method that enforces that the estimated value of a point is influenced more by nearby known points than those farther away.
Figure 16.10 An annual precipitation surface created by the inverse distance squared method.
Figure 16.11 An isohyet map created by the inverse distance squared method.
Thin-Plate Splines Thin-plate splinescreate a surface that passes through the control points and has the least possible change in slope at all points. In other words, thin-plate splines fit the control points with a minimum curvature surface.
Figure 16.12 An isohyet map created by the regularized splines method.
Figure 16.13 An isohyet map created by the splines with tension method.
Kriging • Kriging is a geostatistical method for spatial interpolation. Kriging can assess the quality of prediction with estimated prediction errors. • Kriging assumes that the spatial variation of an attribute is neither totally random (stochastic) nor deterministic. Instead, the spatial variation may consist of three components: a spatially correlated component, representing the variation of the regionalized variable; a “drift” or structure, representing a trend; and a random error term. • The interpretation of these components has led to development of different kriging methods for spatial interpolation.
Semivariogram • Kriging uses the semivariance to measure the spatially correlated component, a component that is also called spatial dependence or spatial autocorrelation. • A semivariogram cloud plots semivariance against distance for all pairs of known points in a data set. If spatial dependence does exist in a data set, known points that are close to each other are expected to have small semivariances and known points that are farther apart are expected to have larger semivariances.
Figure 16.14 A semivariogram cloud.
Binning With all pairs of known points, a semivariogram cloud is difficult to manage and use. Binning is a process that averages semivariance data by distance and direction.
Figure 16.15 A common method for binning pairs of sample points by direction, such as 1 and 2 in (a), is to use the radial sector (b). Geostatistical Analyst to ArcGIS uses grid cells instead (c).
Figure 16.16 A semivariogram after binning by distance.
Model Fitting A semivariogram must be fitted with a mathematical function or model so that it can be used for estimating the semivariance at any given distance.
Figure 16.17 Fitting a semivariogram with a mathematical function or a model.
Figure 16.18 Two common models for fitting semivariograms: spherical and exponential.
Nugget, Range, and Sill • The nugget is the semivariance at the distance of 0, representing measurement error, or microscale variation, or both. • The range is the distance at which the semivariance starts to level off. • The sill is the semivariance at which the leveling takes place.
Figure 16.19 Nugget, range, sill, and partial sill.
Ordinary Kriging Assuming the absence of a drift, ordinary krigingfocuses on the spatially correlated component and uses the fitted semivariogram directly for interpolation.
Figure 16.20 An isohyet map created by ordinary kriging with the exponential model.
Figure 16.21 Standard errors of the annual precipitation surface in Figure 16.20.
Universal Kriging Universal krigingassumes that the spatial variation in z values has a drift or a trend in addition to the spatial correlation between the sample points.
Figure 16.22 An isohyet map created by universal kriging with the linear drift and the spherical model.
Figure 16.23 Standard errors of the annual precipitation surface in Figure 16.22.
Comparison of Spatial Interpolation Methods Using the same data but different methods, we can expect to find different interpolation results. Likewise, different predicted values can occur by using the same method but different parameter values.
Figure 16.24 Differences between the interpolated surfaces from ordinary kriging and IDW.
PRISM http://www.nrcs.usda.gov/technical/maps.html