Spatial Interpolation in GIS
Spatial Interpolation in GIS. Zhongwei Liu, Ph.D. School of Environmental and Public Affairs University of Nevada, Las Vegas Zhongwei.Liu@unlv.edu 2/18/2010. Outline. Spatial interpolation Linear interpolation Nonlinear interpolation Case study Tutorials. Operations on surfaces.


Spatial Interpolation in GIS
E N D
Presentation Transcript
Spatial Interpolation in GIS Zhongwei Liu, Ph.D. School of Environmental and Public Affairs University of Nevada, Las Vegas Zhongwei.Liu@unlv.edu 2/18/2010
Outline • Spatial interpolation • Linear interpolation • Nonlinear interpolation • Case study • Tutorials
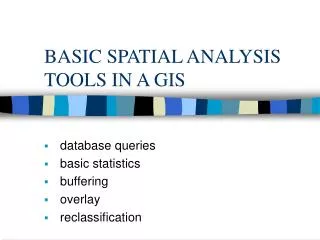
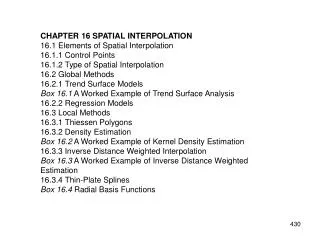
Operations on surfaces • Interpolation • Linear interpolation • Nonlinear interpolation
C B Half way from A to B, Value is (A + B) / 2 A Linear interpolation
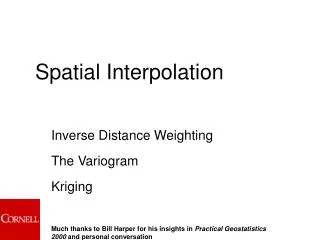
Nonlinear interpolation • Basic types • Inverse Distance Weighted (IDW) • Spline: fits a minimum-curvature surface through the input points • Kriging: use virogram to determine the neighborhood for interpolation
h1 h2 d1 d2 hx=??? d3 h3 1. Inverse Distance Weighted (IDW) • w1=1/d1, w2=1/d2, w3=1/d3 • w=w1+w2+w3 • hx=h1*w1/w+h2*w2/w+h3*w3/w • =(h1*w1+h2*w2+h3*w3)/w • Each input point has a local influence that diminishes with distance • an implementation of Tobler’s First Law of Geography • Use inverse distance as weight for summation of values in a neighborhood • The new [Hmin, Hmax] is within the original [Hmin, Hmax]
4.5 4 3.5 3 2.5 2 1.5 1 0.5 0 100 1 4 7 10 13 16 19 22 25 28 31 34 37 40 43 46 49 52 55 58 61 64 67 70 73 76 79 82 85 88 91 94 97 A potentially undesirable characteristic of IDW interpolation This set of six data points clearly suggests a hill profile. But in areas where there is little or no data the interpolator will move towards the overall mean. Blue line shows the profile interpolated by IDW
2. Spline Like bending a sheet of rubber to pass through points while minimizing curvature of that sheet repeatedly applies a smoothing equation (polynomial) to the surface Resulting surface passes through all points Best for gently varying surfaces, not for rugged ones (can overshoot data values)
variation d* d 3. Kriging • Use virogram to determine the neighborhood for interpolation • Based on spatial auto-correlation • Use d* to define the neighborhood • Fits function to • Specified number of points OR • All points within a window of specified radius • Assumes distance or direction between sample points shows a spatial correlation that help describe the surface. • Kriging differs from the methods discussed so far because kriging can assess the quality of prediction with estimated prediction errors.
Kriging The semi-variogram is based on modeling the (squared) differences in the z-values as a function of the distances between all of the known points.
Cross validation Removing one of the n observation points and using the remaining n-1 points to predict its value. Error = observed - predicted
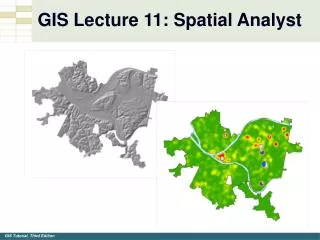
IDW vs. Kriging • Kriging appears to give a more “natural” look to the data • Kriging avoids the “bulls eye” effect • Kriginggives us a standard error IDW Kriging
Which Method to Use? • IDW - assumes variable decreases in influence w/distance from sampled location • Interpolating a surface of consumer purchasing power for a retail store • Spline - best for surfaces that are already smooth • Elevations, water table heights, etc. • Kriging - if you already know correlated distances or directional bias in data • Geology, soil science
Interpolation Software ArcGIS 9.x with Geostatistical Analyst ArcView 3.x Surfer (Golden Software) Surface II package (Kansas Geological Survey) GEOEAS (EPA) Spherekit (NCGIA, UCSB) Matlab
The Everglades 10, 000 islands (tree islands) 6 Inches beneath sea level Average annual rainfall 130 cm Over 2,000 plant species http://sofia.usgs.gov/eden
tree islands wet prairie sawgrass marsh wet prairie slough alligator holes Models based on spatial interpolation for Everglades restoration • Everglades • Subtropical wetland • Dry (Oct.- May) and wet (Jun.- Sept.) seasons • Everglades restoration • $7.8 billion Source: www.broward.edu.
Alligator hole & water level and depth • American Alligator • Top predator, keystone species, ecosystem engineer in Florida Everglades • Alligator Hole • Small but persistent ponds excavated and maintained by alligators • Dry-season refugia • Nest, colonization, and foraging sites
Everglades Depth Estimation Network (EDEN) • Funded by Comprehensive Everglades Restoration Plan (CERP) and USGS Priority Ecosystem Sciences (PES) • Integrated network of real-time water level monitoring, ground elevation modeling, and water-surface modeling • Daily water level/stage data from 253 gage stations A marsh gage station
EDEN Water-Surface Model • Developed by Pearlstine et al. (2007), validated by Liu et al. (2009) • Spatial interpolation of water levels at 240 gage stations in ArcGIS: radial basis function (RBF) • Basic model outputs • Water level/stage (direct output) • Water depth (= water level – DEM) • 2000 – present • Cell resolution: 400 m
EDEN DEM (Digital Elevation Model) • Developed by Jones and Price (2007) • Spatial interpolation ofHigh Accuracy Elevation Data (HAED) in ArcGIS: kriging • HAED elevation points collected via Airborne Height Finder and airboat • Cell resolution: 400 m
Revisions of EDEN Water-Surface Model Modification to the canals files to better represent NE Shark River Slough in the area of Tamiami Trail and L67 Extension
Revisions of EDEN Water-Surface Model • Reparameterization of the EDEN water-surface model • With new gage stations (including coastal) • With resurveyed gage information (locations, water levels) in NAVD88 datum • RBF surface interpolation by EDEN sub-regions
EDEN DEM revision - WCA 1 • Spatial trend • Kriging interpolation • Ordinary kriging • Universal kriging (considering the trend) • Cross-validation • Validation with independent elevation data derived from measured depths (PI depth, n = 1,491)
PI data Kriging by 3 landscape units • Kriging by landscape unit (north, center, south) • Removed HAED elevation point based on SFWMD new vegetation/land use map • HAED point falling on upland + others; and • areal coverage of upland + others in the EDEN cell less than 33%
Revised Current released DEM