Download
1 / 37
430 likes | 1.09k Vues
Intro to MS & Mass Analyzers 1: Time-of-flight Mass Spectrometry. CU- Boulder CHEM-5181 Mass Spectrometry & Chromatography Jose-Luis Jimenez Fall 2009. Lecture Slides adapted from 2007 lecture by Dr. Joel Kimmel, CU-Boulder. Business Items. Review calendar for labs

E N D
Intro to MS & Mass Analyzers 1: Time-of-flight Mass Spectrometry CU- Boulder CHEM-5181 Mass Spectrometry & Chromatography Jose-Luis Jimenez Fall 2009 Lecture Slides adapted from 2007 lecture by Dr. Joel Kimmel, CU-Boulder
Business Items • Review calendar for labs • Small change to pre-lab • Instead of matrices of CHCA, SA, DHB and urea, you will be using CHCA, SA, DHB and "no matrix". • TOFMS HW assigned later today by email • Igor simulation of TOFMS • Start looking for articles to present • 1st journal skim due on Thu next week
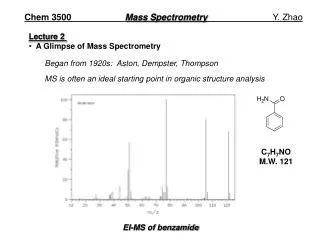
A mass spectrometer determines the mass-to-charge ratio (m/z) of gas-phase ions by subjecting them to known electric or magnetic fields and analyzing their resultant motion.
Mass Spectrum Signal intensity vs mass-to-charge ratio
m/z The mass-to-charge ratio is often referred to as m/zand is typically considered to be unitless: m: the mass number = atomic mass/u (u = 1/NA g) z: the charge number = Q/e (e = 1.6022 × 10⁻¹⁹ C) The Thompson has been proposed as a unit for m/z, but is only sometimes used. Historically, most ions in MS had z = 1, which is likely the cause for the confusion in units. But, due to new ionization techniques, this is no longer true.
Signal Intensity • Depending on the type of mass spectrometer, ions may be detected by direct impact with a detector or by monitoring of an induced current image. • Recorded signal can be measured in: • Counts per unit time (Digital) • Voltage per unit time (Analog) • Power (Frequency domain) • To a first approximation, relative signal intensity reflects relative ion abundance
MS Oscilloscope http://www.vias.org/simulations/simusoft_msscope.html
An ion with m/z = m has charge equal: (a) 1 Coulombs (b) m Coulombs (c) 1.6022 × 10⁻¹⁹ Coulombs (d) e Coulombs (e) I don’t know
Early stages of MS: Precise determination of atomic masses and isotope abundances. • Last 50 years: Shift towards analytical applications involving molecules of greater complexity • Last 15 years: Explosion of biological applications • 1897: J.J Thompson discovers electron and determines in m/z • 1912: JJ Thompson constructs first mass spectrometer • 1918: Demster develops electron ionization source • 1942: First commercial instrument for organic analysis • 1956: First GC-MS • 1974: First HPLC-MS • 1987: MALDI demonstrated; 1988 ESI Demonstrated; shared Nobel Prize in 2002 • See extended history in introduction of DeHoffmann
“A Universal Technique” Sample • Analysis by MS does not require: • Chemical modification of the analyte • Any unique or specific chemical properties • In theory, MS is capable of measuring any gas-phase molecule that carries a charge • Analyzed molecules range in size from H+ to mega-Dalton DNA and intact viruses • As a result, the technique has found widespread use • Organic, Elemental, Environmental, Forensic, Biological, Reaction dynamics … Ionization Source Mass Analyzer Detector All experiments have this basic backbone, but range of applications implies a diversity of experimental approaches. PC (Acquisition and Analysis)
Ionization Source Mass Analyzer Sample “A mass spectrometer determines the mass-to-charge ratio (m/z) of gas-phase ions by subjecting them to known electric or magnetic fields and analyzing their resultant motion.” The ionization source imparts energy into the sample in order to drive (i) conversion to gas-phase (if necessary) and (ii) ionization of molecule The mass analyzer manipulates the motion of the ions. Requires vacuum! (Consider mean free path) Many systems will require transport of gas-phase sample from atmospheric pressure to vacuum, before or after ionizations step.
Mass Analyzer Resolving Power Mass peak width (Δm50%)Full width of mass spectral peak at half-maximum peak height Mass resolution / Resolving Power (m /Δm50%)Quantifies ability to isolated single mass spectral peak Mass accuracy Mass accuracy is the ability to measure or calibrate the instrument response against a known entity. Difference between measured and actual mass Figure from: M. P. Balogh, LC-GC Europe, 17(3), 152–159 (2004)
Which of the following pairs requires the greatest mass resolving power to distinguish: • Ar+ from Ar2+ • CO+ from N2+ • CH3+ from CDH2+ • I don’t know • I need a coffee • Info: • Ar = 39. 9623837 u, C = 12 u, O = 15.9949 u, N = 14.003 u, H = 1.007 u, and D = 2.0141 u
Electric Field Lines + X - - - - - - - + + + Y + + Ion Motion in Electrostatic Fields • Electrical force on an ion: • Q: Would ions originating at X and Y be arrive at negative surface at the same time? • Yes • X will arrive before Y • Y will arrive before X • I don’t know • I still need a coffee
Types of Mass Analyzers • Time-of-flight (TOF) • Sector • Magnetic • Electric • Quadrupoles • Ion traps • Orbitrap • Ion-Cyclotron Resonance (ICR) • Fourier Transform (FTMS) • Hybrids
Deborah Gross Carleton College Bipolar TOF voltage scheme V Relative Intensity Relative Intensity Relative Intensity Relative Intensity Relative Intensity Relative Intensity m/z a t1/2 m/z a t1/2 m/z a t1/2 m/z a t1/2 m/z a t1/2 m/z a t1/2 Time-of-Flight Mass Spectrometry
Time-of-Flight Mass Spectrometry To determine m/z values A packet of ions is accelerated by a known potential and the flight times of the ions are measured over a known distance. Q: What are V, e, and z? • Key Performance Notes • Based on dispersion in time • Measures all m/z simultaneously, implying potentially high duty cycle • “Unlimited” mass range • DC electric fields • Small footprint • Relatively inexpensive
a TOFMS Drift Region, D Source, S Detector V E = 0 E = V/S Ions accelerated by strong field, E, within short source region, S. Drift times recorded across long, field-free drift region, D. vDdepends on starting position of ion – ideally all ions start from same plane. Q: What else is ideally assumed (Uo, E, D, …)? Q: What figures of merit will non-ideality affect? Drawing adapted from p20 of Cotter reference on next slide.
Actual Picture More Complex TOF = total recorded flight time of an ion to = Ion formation time after T0 of TOF measurement ta = Time in acceleration region, which depends on initial position and initial energy tD = Time in drift region, which depends on initial position and initial energy td = Response time of detector For detailed discussion see: Guilhaus, J. Mass. Spec, 1519, 1995. Cotter, “Time-of-flight Mass Spectrometery: Instrumentation and Applications in Biological Research,” ACS, 1997.
Resolution For any m/z in a time-of-flight mass spectrum, the recorded peak will be the sum of signals corresponding to multiple, independent, ion arrival events Each ion arrival will be recorded at a unique TOF, as determined by expression on previous slide TOF’, which is the center of the peak in the mass spectrum, will be an average of all individual ion arrival TOFs The width of TOF’, Δt, will depend on the distribution of the individual ion arrival TOFs (and other factors …)
Improving Resolution • TOFMS was first commercialized in 1950s • Early instruments had limited resolution • Speed of electronics • Energy distribution • Recent “Renaissance ….”
Delayed Ion Extraction / Time-Lag Focusing x V0 V1 V0 V1 V2 V2 Modified from Cotter: http://www.hopkinsmedicine.org/mams/MAMS/middleframe_files/teaching_files/ME330.884/2005/MS2005-Lecture-5-Instrumentation.pdf From De Hoffmann Delay between ionization and extraction events. At ionization: U = U0 (Initial Energy of Ion) At exit of extraction: U = U0 + Eextxq At beginning of drift: U = U0 + Eextxq + (V1-V2)q Tune source voltages and/or delay to compensate for ΔU0 and create space focus at detector. Mass dependent. From Guilhaus, J. Mass. Spec, 1519, 1995.
Reflectron Reflectron consists of a series of electrodes, forming a linear field in direction opposite of initial acceleration. Ions are slowed by this field, eventually turning around and accelerating back in direction of detector. Penetration depth depends on Us, which is function of U0 and acceleration field, E. Reflectron voltages are tuned to create a space focus at the plane of the detector. From: http://www.chemistry.wustl.edu/~msf/damon/reflectrons.html
Comparison of DE vs Reflectron • In Delayed Extraction, we give ions different U to achieve same TOF. • In Reflectron, ions possess different U. We force them to travel different D to achieve same same TOF
An Inherent Dilemma hv TOFMS is an ideal detector for pulsed ionization methods If ionization event is synchronized with time zero, high duty cycle is achieve Laser Desorption: Static, solid sample probed with a pulsed laser Because of pulsing, ions are wasted when TOFMS is applied to a continuous source & Increased efficiency comes at the expense of mass range and mass resolution Still, figures of merit and cost make the technique desirable ESI: Sample is continuously flowing towards the mass analyzer
Sampling Time Duty Cycle Sampling Time +Drift Time Performance Trade-offs: On Axis Gating Function t Drift Time Sampling Time Δt proportional to sampling time Mass Range proportional to drift time Ion Beam GATE
Orthogonal Extraction t GATE Ions are extraction in a direction orthogonal to source trajectory Extraction event is still rapid (Δt), but extraction volume is determined by length of gate region. t
oTOFMS • Able to reduce average initial energy in ToF direction to 0 (resolution and accuracy). • Independent control of beam energy and drift energy, allows maximum duty cycle. • Want tightly collimated beam in extraction region See: Guilhaus, et al. Mass Spec Rev, 2000, 65-107
TOFMS Animation from Agilent: http://www.chem.agilent.com/en-us/products/instruments/ms/6210time-of-flightlcms/pages/gp10184.aspx
Resources for Journal Skims Web of Science http://apps.newisiknowledge.com/ VPN for Off-campus Access to Electronic Journals and Web of Science http://www.colorado.edu/its/vpn/ Restricted pdfs on course website chem5181 and pass5181
A mass spectrometer with a resolution of 5000 should be capable of resolving isotopic peaks for singly charged species with m (a) Of any value (b) Less than 5000 u (c) Greater than 5000 u (d) It depends on the type of mass spectrometer
(a) Of any value (b) Less than 5000 u (c) Greater than 5000 u (d) It depends on the type of mass spectrometer
Calculate resolution and accuracy? Argon Atomic Weight (Da): 39.948 39.9600 0.015934
Which of the following requires the mass greatest resolving power, distinguishing: • Ar+ from Ar2+ • CO+ from N2+ • CH3+ from CDH2+ • Ar = 39. 9623837 u, C = 12 u, O = 15.9949 u, N = 14.003 u, H = 1.007 u, and D = 2.0141 u m/Δm = R 40/20 = 2 28/.01 = 2800 15/1 = 15 Note that requirements for isotopes with grow with m/z!
Electric Field Lines + A - - - - - - - + + + B + + Force: F = qE Effective Voltage: V = Es Potential: U = Vq Potential: U = (Es)q sA sB