Sustainable Wastewater Treatment with Activated Cocoa Shells
Explore the use of cocoa shells as activated carbon for wastewater treatment to combat pharmaceutical contamination in water streams. Learn about pyrolysis, activation methods, and surface area enhancement of cocoa shells through chemical and physical processes.

Sustainable Wastewater Treatment with Activated Cocoa Shells
E N D
Presentation Transcript
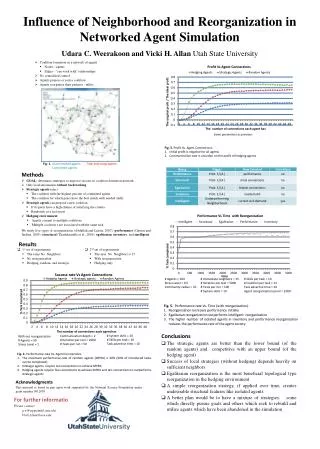
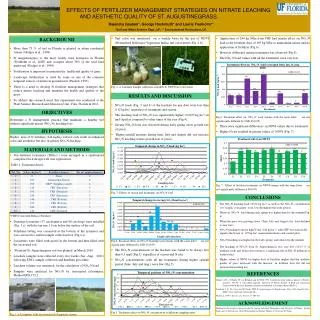
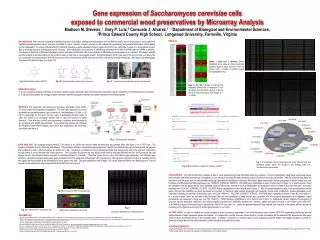
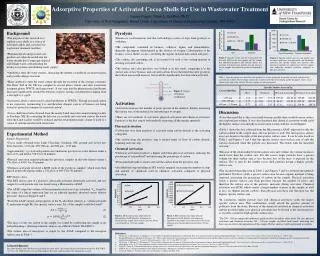
Adsorptive Properties of Activated Cocoa Shells for Use in Wastewater Treatment Lauren Pappas, Jillian L. Goldfarb, Ph.D. University of New Hampshire, Hamel Center, Department of Chemical Engineering, Durham, NH 03824 • Background • The purpose of this research is to • explore cocoa shells as a source of • activated carbon and a resource for • wastewater treatment facilities. • Pharmaceuticals and personal care • products are often discarded into the • water streams due to improper disposal • and human waste, contaminating the • nearby ecosystems and drinking water supply1. • Antibiotics enter the water streams, increasing the number of antibiotic resistant bacteria and possible allergic reactions. • Many antibiotics enter the water stream through the excretion of the average consumer. The River Taff in the UK was sampled in several places, before and after wastewater treatment plants, WWTP, and large towns2. It was seen that the pharmaceutical pollutants increased significantly around the domestic regions, having concentrations ranging from a few ng/L to 1 μg//L. • Activated carbon is often used to adsorb pollutants in WWTPs. Though activated carbon is not expensive, regenerating it is and therefore cheaper sources of biomass are being looked at instead of commercial activated carbon3. • Cocoa shells have been obtained from the nearby Lindt chocolate manufacturing facility in Stratham, NH. By converting the left over cocoa shells into activated carbon, the waste from the Lindt facility would be reduced and the environment made cleaner if used as a source of sorbent material with wastewater. • Pyrolysis • Biomass is a carbonaceous fuel that will undergo a series of steps from pyrolysis to oxidation. • The compounds contained in biomass, cellulose, lignin, and hemicellulose, thermally decompose when heated in the absence of oxygen. Carbonization of the biomass (cocoa shells) occurs, converting the organic material into carbon and gases. • The carbon, also containing ash, is recovered to be used as the starting material in creating activated carbon. • The surface area after pyrolysis was looked at in this study, comparing it to the surface area of raw biomass and activated carbon. It was theorized that after pyrolysis the surface area would increase, but would be significantly less than when activated. • Activation • Activation increases the number of pores present in the material, thereby increasing the surface area of the material, by introducing it to oxygen. • There are two methods of activation, physical activation and chemical activation. Pyrolysis is the first step to both methods, removing all the organic materials. • Physical Activation • Carbon left over from pyrolysis is activated using carbon dioxide as the activating compound. • The carbon from the pyrolysis step is heated under of flow of carbon dioxide, requiring only one step. • ChemicalActivation • Chemical activation produces a higher yield than physical activation, reducing the percentage of tar produced4 and increasing the percentage of carbon. • Potassium hydroxide is used to activate the carbon from the pyrolysis step. • An additional step including an HCl wash is required, increasing the number of steps and amount of chemicals used in chemical activation compared to physical activation. Figure 4. Specific surface area for each particle size of cocoa shell for the raw samples and the samples that underwent pyrolysis. The specific surface area increases with decrease in particle size and increases for the samples that underwent pyrolysis compared to raw. Figure 5. Specific surface area for each particle size of cocoa shells that were physically and chemically activated. The specific surface area increases with decrease in particle size and increases for the samples that underwent chemical activation compared to physical activation. Table 1. Specific surface areas found for each particle size of raw, pyrolyzed, chemically activated, and physically activated cocoa shells. The mesopore surface area is shown in the left of the column and the micropore surface area is shown in the right of the column. The raw samples are only mesoporous. • Discussion • It was theorized that as the cocoa shells became smaller there would be more surface area exposed per volume. It was also theorized that chemical activation would yield the highest surface area and physical activation would yield the second highest. • Table 1 shows the data collected from the Micrometrics ASAP, adjusted for only the carbon content in the sample since ash was present as well. The microporous surface areas are shown to the right of the mesoporous surface areas. It can be seen based on Table 1 and Figures 3 and 4 that the specific surface area (surface area of only the carbon) increased when the particle size decreased. This holds with the theorized outcome*. • Because of the relationship between surface area and volume, the volume increases much faster than the surface area. For this reason larger particles have a greater volume but their surface area is less because less of the mass is exposed on the surface. This is seen by the smaller cocoa shell particles having a higher specific surface area. • The second relationship seen in Table 1 and Figures 3 and 4 is between the methods performed. Pyrolysis yields a greater surface area because organic material is being removed, increasing the percentage of carbon in the sample. Physical activation yields a greater surface area than pyrolysis because the number of pores, and therefore the surface area of the particles, increases during activation. Chemical activation uses KOH, which creates a larger number of pores in the sample, as well as less tar (higher percent carbon), than physical activation and therefore has the highest specific surface area. • In conclusion, smaller particle sizes and chemical activation yields the largest specific surface area. This combination would adsorb the greatest amount of pollutants from the water. Because of the chemicals involved in chemical activation and the possible higher cost, physical activation may be desired as the chosen process as it yields a relatively high specific surface area. • *The 250 – 300 μm sample that underwent pyrolysis does not follow either trend. The raw, physical activation, and chemical activation 250 – 300 μm samples do follow both trends, indicating that there was an error in the preparation of this sample. Further analysis will be performed to confirm. • Experimental Method • Sample Preparation • Cocoa shells obtained from Lindt Chocolate, Stratham, NH, ground and sieved into three fractions: <125 μm, 250-300 μm, and 600 μm – 2.38 mm. • Approximately 1 g of of each particle size underwent pyrolysis in a tube furnace under a flow of N2and held at 550°C for 20 minutes. • Physical activation required placing the pyrolysis samples in the tube furnace under a CO2flow at 650°C for 30 minutes. • Chemical activation involved a KOH wash of the pyrolysis samples5 which were thenplaced in the tube furnace under a CO2 flow at 650°C for 30 minutes. • BET Surface Area • The BET surface area of a pyrolysis, physically activated, chemically activated, and raw sample for each particle size was found using a Micrometrics ASAP. • The ASAP output the volume of the monomolecular layer of gas adsorbed, Vm, found by the slope of a linear regression line for an adjusted quantity adsorbed versus relative pressure4, shown in Figure 2 and 3. • From the ASAP outputs and properties of the N2 adsorbent (density ρ, volume per mole V, molecular weight M), the specific surface area, SA, of the samples could be found6,7 • (1) • (2) • The mass of only the carbon in the sample was found by combusting the sample in air and performing a thermogravimetric analysis on a Mettler Toledo TGA/DSC1. • The surface area of micropores is output by the ASAP, compared to the mesopore surface area in Table 1. Figure 1. Stages of biomass combustion Figure 2. BET isotherm data output from the Micrometrics ASAP. Quantity of nitrogen gas adsorbed to the sample versus relative pressurefor the raw and pyrolysis <125 μm samples. Figure 3. BET isotherm data output from the Micrometrics ASAP. Quantity of nitrogen gas adsorbed to the sample versus relative pressure for the chemical activation and physical activation <125 μm samples. References Theivarasu, C. Mylsamy, S., Sivakumar, N. “Cocoa Shell as Adsorbent for the Removal of Methylene Blue from Aqueous Solution: Kinetic and Equilibrium Study.” University Journal of Environmental Research and Technology. 1 70-78. 2011. Kasprzyk-Hordern, B., Dinsdale, R.M., Guwy, A.J. “Multi-residue method for the determination of basic/neutral pharmaceuticals and illicit drugs in surface water by solid-phase extraction and ultra performance liquid chromatrography-positive electrospray ionisation tandem mass spectrometry.” Journal of Chromatography A. 1161, 1-2. 17 Aug 2007. 132-145. Theivarasu, C. Mylsamy, S., Sivakumar, N. “Cocoa Shell as Adsorbent for the removal of Methylene Blue from Aqueous Solution: Kinetic and Equilibrium Strudy.” Universal Journal of Environmental Research and Technology. 1. 2011. 70-78. Ahmadpour, A. Do, D. D. “The preparation of active carbons from coal by chemical and physical activation.” Elsevier Science Ltd. 34, 4. 1996. 471-479. Tseng, R., Tseng, S. “Characterizatoin and use of hight surface area activated carbons prepared from cane pith for liquid-phase adsorption.” Journal of Hazardous Materials. B136. 2006. 671-680. Webb, P. Orr, C. “Analytical Methods in Fine Particle Technology.” Micrometrics Instrument Corporation. 1997. Lowell, S. Shields, J. “Powder Surface Area and Porosity.” Chapman and Hall. 1984. Acknowledgments The author thanks Lindt Chocolates for providing the cocoa shells , the National Science Foundation (Grant No. NSF CBET-1127774 ), the UNH Hamel Center for Undergraduate Research, and Dana Hamel for funding the research.