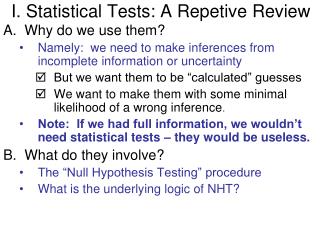
Statistical Review
Statistical Review. Chul H. Ahn, Ph.D. Biostatistician CDRH/FDA. Population and Sample. Population - a collection of objects of interest Sample – a subset of the population Want to know about the population using sample. Should be representative of the population. .


Statistical Review
E N D
Presentation Transcript
Statistical Review Chul H. Ahn, Ph.D. Biostatistician CDRH/FDA DRAFT
Population and Sample • Population - a collection of objects of interest • Sample – a subset of the population • Want to know about the population using sample. • Should be representative of the population. DRAFT
BTT Study (original submission) • Two-arm, non-randomized study (225 pts) Either the patient received the Novacor LVAS (Treatment) or was treated with medical management (Control group) • 190 LVAS patients, and 35 Controls (28 retrospective, 7 concurrent) • Primary endpoint - survival time, with transplant considered as censoring DRAFT
Current Study • Using the subset of data from BTT study - Seek to expand the indication to include the patients with “relative contraindication (RC).” • Of the 225 patients, the sponsor found 87 patients who are considered to have “RC.” • Of the 87 patients, 75 are LVAS, and 12, Controls. • The sponsor claims device’s effectiveness based on these 87 patients. DRAFT
75 RC BTT Population Population With “Relative Contraindication” 190 LVAS 87 “RC” 35 Con 12 RC DRAFT
75 RC BTT Population Population With “Relative Contraindication” 190 LVAS 87 “RC” 35 Con 12 RC DRAFT
Retrospective Subgroup Analysis • Can the sponsor extend the result based on the 87 patients to the entire population with “relative contraindications”? 4Problematic, because this subgroup may not berepresentative of the population with “relative contraindications” DRAFT
75 LVAS vs. 12 CONTROLs Are they comparable? • The year of implant • Baseline covariates • Propensity scores DRAFT
Year of Implants DRAFT
Differences in Baseline Covariates Factor Control LVAS p-value Milrinone 0.0 0.3 0.000 Pre. Antihyper. 83.3% 33.3% 0.001 Age 41.8 49.9 0.038 Prev. TIA 16.7% 1.3% 0.047 Dobutamine 12.7 9.1 0.065 Creatinine 2.5 1.9 0.076 Bleeding 16.7% 2.7% 0.084 DRAFT
Treatment Comparisons • Two treatment groups are not comparable • Imbalance of the year of implant • Imbalance in multiple baseline covariates • Any direct treatment comparisons on effectiveness endpoints are problematic • So, all p-values from direct treatment comparisons are uninterpretable DRAFT
Treatment Comparisons (cont.) • What about treatment comparisons adjusting for imbalanced covariates? • Traditional covariate analysis • Propensity score analysis • Example of adjustment for one covariate, e.g., health condition DRAFT
One Covariate: Health Condition Suppose the event rate is higher in the control group where there are sicker patients. Then, the lower event rate in the treatment group may not be due to the treatment, but simply because there are healthier patients in the treatment group Should Compare patientswith similar health condition! DRAFT
One solution: Replace the collection of covariates with one single number (propensity score) Age, Gender,Propensity Health condition, …Score (PS) PS: The conditional probability of receiving the LVAS, given a patient’s observed baseline covariate values, e.g., age, gender, prior cardiac surgery, … What If There Are ManyCovariates? DRAFT
Propensity Scores • When the propensity scores are balanced across the treatment and control groups, the distribution of all the covariates are balanced in expectation across the two groups • So, we can use the propensity scores as a diagnostic tool to measure treatment group comparability • The two treatment groups will be comparable if there is enough overlap between them. DRAFT
Propensity Score Analysis • Adjusted for all imbalanced and/or clinically important baseline covariates • The propensity score model accurately predicted the treatment group membership • However, the two treatment groups did not overlap enough to allow a sensible treatment comparison DRAFT
Propensity Scores 57 (76%) 6 3 5 6 7 (9%) 3 DRAFT
Distributions of Propensity Scores 4 8 18 17 17 13 10 <.749 <.922 <.983 <.996 <1.00 DRAFT
Propensity Score Analysis • So, any treatment comparisons adjusting for imbalanced covariates are problematic DRAFT
Concerns with Sponsor’s Survival Curves • Two treatment groups are not comparable • Survival time is not independent of censoring • p-values may not be interpretable 4If we assume that the two treatment groups were comparable, then we may also find a subgroup with significant difference in survival curves between two treatments DRAFT
BTT Population Population With “RC” X “RC” “RC” Y DRAFT
Statistical Summary • Subgroup with “RC” maynot be representative of intended patient population • Two groups (75 LVAS and 12 Controls) are not comparable so that any direct or covariate adjusted treatment comparison is problematic