Download
1 / 42
420 likes | 421 Vues
This presentation discusses the prospects for enhanced hydrological and agricultural drought prediction by examining the role of precipitation forecasts. It explores the nature of hydrologic prediction, predictability, opportunities for improvement, and the development of a national hydrologic prediction strategy.

E N D
Dennis P. Lettenmaier Department of Civil and Environmental Engineering University of Washington Climate Diagnostics and Prediction Workshop Tallahassee, FL October 24, 2007 Prospects for improved hydrological and agricultural drought prediction: The role of precipitation forecasts
The nature of hydrologic prediction Hydrologic predictability: the role of precipitation forecasts Predicting drought recovery – the role of initial conditions Where are the opportunities for improvement? Towards a national hydrologic prediction strategy Talk Outline
Overview: Hydrologic prediction strategy month 6-12 start of month 0 1-2 years back forecast ensemble(s) model spin-up climatology ensemble Observations Initial conditions update Note that for hydrologic forecasts, benchmark is NOT climatology, but rather hydrologic model forced with climatological resampling (ESP)
Results of previous seasonal hydrologic predictability studies for continental U.S. • Wood et al, “A retrospective assessment of NCEP climate model-based ensemble hydrologic forecasting in the western United States”, JGR, 2005 • Maurer and Lettenmaier, “Predictability of seasonal runoff in the Mississippi River basin”, JGR, 2003 • Wood, “An ensemble-based framework for characterizing sources of uncertainty in hydrologic prediction”
Maurer and Lettenmaier - Estimation of Runoff Predictability Mississippi River Basin • Strong gradient in precipitation and runoff • Winter runoff concentrated in SE • High snowmelt runoff in summer
Lead-4 Lead-3 Lead -2 Lead 1 Lead-0 Forecast Season DJF M A N F M A J J S O D J Dec 1 Mar 1 Jun 1 Sep 1 Dec 1 Initialization Dates for DJF Forecast Methods for Determining Runoff Predictability • Indices Characterizing Sources of Predictability: • SOI – An index identifying ENSO phase • AO – An index of phase of the Arctic Oscillation • SM – Soil moisture level (normalized) • SWE – Snow water equivalent (normalized) • Varying Lead Times between IC and Forecast Runoff • Only Use Indices in Persistence Mode Climate Land
Runoff r2SWE r2SOI/AO SOI/AO SWE Methods 2 • Multiple linear regression used between IC and runoff • Variance explained (r2) indicates level of predictability • Variables introduced in order • of how well indices represent • current knowledge of state: • SOI/AO • SWE • SM • Incremental predictability
Methods 3 Test for Significant Predictability (r2) in 2 steps • Local Significance: • Tested at each grid cell • Accounts for temporal autocorrelation • 95% confidence level estimated • Field Significance (Livezey and Chen, 1983): • Tests area showing local significance over entire basin • Accounts for limited sample size, spatial correlation in both predictors and predictand • 95% confidence for field significance
Total Runoff Predictability Lead, months 1.5 4.5 7.5 10.5 13.5 • Uses all 4 indices to predict runoff • “X” no field significance • Predictability deteriorates with time
Predictability due to Climate • Predictors currently available • Moderate levels of r2 • Greater influence in winter, in area and lead time • Difficulty in long-lead persistence prediction with climate signals
Predictability Due to Snow • r2 represents incremental increase • Focus at 1 or more season lead is in Rocky mountains • At level of Mississippi basin, predictability limited to 1-2 seasons • Analysis by sub-area could reveal greater predictability
Predictability due to Soil Moisture • Widespread predictability at 0 lead (1½ month) • Winter Runoff: little predictability where runoff is high • Summer Runoff: limited predictability to 3 seasons
Reverse ESP vs ESP – typical results for the western U.S. Columbia R. Basin fcst more impt ICs more impt Rio Grande R. Basin
Wood et al 2005: Retrospective Assessment: Results using GSM General finding is that NCEP GSM climate forecasts do not add to skill of ESP forecasts, except… April GSM forecast with respect to climatology (left) and to ESP (right)
Wood et al 2005: Retrospective results for ENSO years Summary: During strong ENSO events, for some river basins (California, Pacific Northwest) runoff forecasts improved with strong-ENSO composite; but Colorado River, upper Rio Grande River basin RO forecasts worsened. October GSM forecast w.r.t ESP: unconditional (left) and strong-ENSO (right)
USGS streamflow gauges that are used in the evaluation of streamflow predictions Luo, L. and E. F. Wood (2007): Seasonal Hydrologic Prediction with the VIC Hydrologic Model for the Eastern U.S. Journal of Hydrometeorology. In review.
The evaluation of streamflow predictions over selected gauges. The ranked probability score (RPS) for monthly streamflow for the first three months are examined against the offline simulation. The bars are for CFS, CFS+DEMETER and ESP from the left to the right, respectively. RPS: 0~1 with 0 being the perfect forecast 3 tercels, below normal, normal and above normal with probability of 1/3 each. Luo, L. and E. F. Wood (2007): Seasonal Hydrologic Prediction with the VIC Hydrologic Model for the Eastern U.S. Journal of Hydrometeorology. In review.
Drought recovery – the concept • Real-time applications!
Initial soil moisture percentiles 2/2006 1 month lead, forecast for 3/2006 3 month lead, forecast for 5/2006 6 month lead, forecast for 8/2006)
Feb Mar Apr May Jun Jul Aug California-Arizona drought
Feb Mar Apr May Jun Jul Aug Texas drought
Comparison of soil moisture forecasts (ensemble mean of monthly average precipitation expressed as the percentile value within the climatological distribution) from three forecast approaches and observations for summer 1988 Luo, L. and E. F. Wood (2007): Seasonal Hydrologic Prediction with the VIC Hydrologic Model for the Eastern U.S. Journal of Hydrometeorology. In review.
Soil moisture Surface observations Remote sensing Snow Areal extent Water equivalent Other (streamflow?) Opportunities for improving the initial conditions for seasonal hydrologic prediction
State soil moisture networks – Illinois (19 stations) and Oklahoma mesonet (~60 stations)
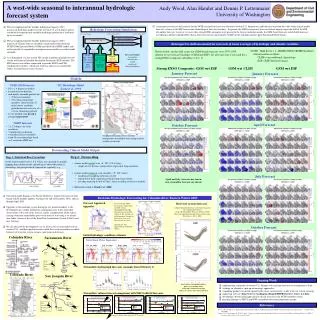
UW West-wide forecast system streamflow forecast points Soil moisture nowcast Streamflow forecast points
MODIS updating of snow covered area MODIS Update local scale weather inputs Initial Conditions: soil moisture, snowpack Hydrologic model spin up Hydrologic simulation Ensemble Forecast: streamflow, soil moisture, snowpack, runoff NCDC met. station obs. up to 2-4 months from current LDAS/other real-time met. forcings for remaining spin-up End of Month 6 - 12 1-2 years back 25th Day of Month 0 Change in Snowcover as a Result of MODIS Update for April 1, 2004 Forecast Snowcover before MODIS update Snowcover after MODIS update
Unadjusted vs adjusted forecast errors, 2001-2003, for reservoir inflow volumes (left plot) and reservoir storage (right)
In principle, attractive since it measures the “right” variable (water equivalent rather than extent) AMSR-E product probably is best current generation, but numerous problems (mostly generic): Coarse resolution (~ 15-25 km) Saturation at 100-200 mm SWE Requires dry snowpacks (algorithms fail if there is liquid water in the pack) Algorithms unreliable for mixed pixels (especially forest) Signature is highly sensitive to grain size (and other snow microphysical properties) Passive microwave remote sensing for snow water equivalent
Hydrologic prediction skill at S/I lead times comes mostly from initial conditions. Hence more focus on data assimilation, and its implications for forecast skill in a climatological context, needs more attention. For drought, ESP may be the most viable method for drought recovery prediction. The role of model error in hydrologic predictions needs more focus – how do we best weight land models in multimodel ensemble? Concluding thoughts
Soil moisture from UW west-wide forecast system and surface water monitor reconstruction Aug 1934 real-time 10/13/07