Download
1 / 26
270 likes | 722 Vues
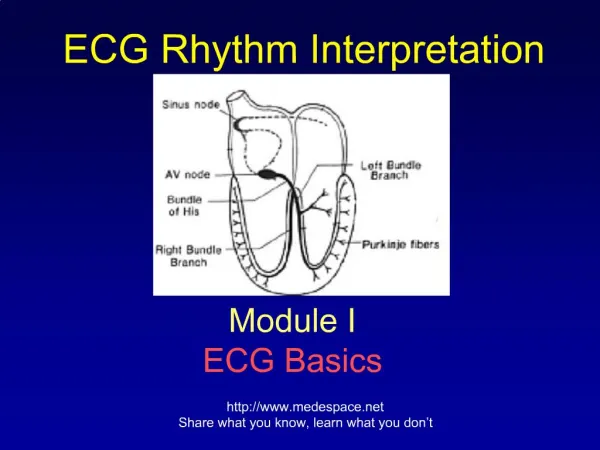
ECG Rhythm Interpretation. Module VII a Reading 12-Lead ECG’s. Course Objective. To systematically analyze a 12-lead ECG. Learning Modules. ECG Basics How to Analyze a Rhythm Normal Sinus Rhythm Heart Arrhythmias Diagnosing a Myocardial Infarction Advanced 12-Lead Interpretation

E N D
ECG Rhythm Interpretation Module VII a Reading 12-Lead ECG’s
Course Objective • To systematically analyze a 12-lead ECG.
Learning Modules • ECG Basics • How to Analyze a Rhythm • Normal Sinus Rhythm • Heart Arrhythmias • Diagnosing a Myocardial Infarction • Advanced 12-Lead Interpretation • Reading 12-Lead ECG’s
Reading 12-Lead ECGs • The 12-Lead ECG contains information that will assist you in making diagnostic and treatment decisions in your clinical practice. In previous modules you learned how to read and interpret parts of the ECG. Now, we will bring all that you have learned together so that you can systematically read and interpret a 12-lead ECG. • The information will be divided into two modules, VII a and VII b.
Reading 12-Lead ECGs The best way to read 12-lead ECGs is to develop a step-by-step approach (just as we did for analyzing a rhythm strip). In these modules we present a 6-step approach: • Calculate RATE • Determine RHYTHM • Determine QRS AXIS • Calculate INTERVALS • Assess for HYPERTROPHY • Look for evidence of INFARCTION
Rate Rhythm Axis Intervals Hypertrophy Infarct • In Module II you learned how to calculate the rate. If you need a refresher return to that module. • There is one new thing to keep in mind when determining the rate in a 12-lead ECG…
Rate Rhythm Axis Intervals Hypertrophy Infarct If you use the rhythm strip portion of the 12-lead ECG the total length of it is always 10 seconds long. So you can count the number of R waves in the rhythm strip and multiply by 6 to determine the beats per minute. Rate? 12 (R waves) x 6 = 72 bpm
Rate Rhythm Axis Intervals Hypertrophy Infarct • In Module II you learned how to systematically analyze a rhythm by looking at the rate, regularity, P waves, PR interval and QRS complexes. • In Modules III, IV and V you learned how to recognize Normal Sinus Rhythm and the 13 most common rhythm disturbances. • If you need a refresher return to these modules.
Rate Rhythm Axis Intervals Hypertrophy Infarct Tip: the rhythm strip portion of the 12-lead ECG is a good place to look at when trying to determine the rhythm because the 12 leads only capture a few beats. Rhythm? Atrial fibrillation 1 of 12 leads Lead II Rhythm strip
RateRhythm Axis Intervals Hypertrophy Infarct Axis refers to the mean QRS axis (or vector) during ventricular depolarization. As you recall when the ventricles depolarize (in a normal heart) the direction of current flows leftward and downward because most of the ventricular mass is in the left ventricle. We like to know the QRS axis because an abnormal axis can suggest disease such as pulmonary hypertension from a pulmonary embolism.
-90o -60o -120o -150o -30o 180o 0o 30o 150o 60o 120o 90o RateRhythm Axis Intervals Hypertrophy Infarct The QRS axis is determined by overlying a circle, in the frontal plane. By convention, the degrees of the circle are as shown. The normal QRS axis lies between -30oand +90o. A QRS axis that fallsbetween -30oand-90o is abnormal and called left axis deviation. A QRS axis that falls between+90oand+150o is abnormal and called right axis deviation. A QRS axis that falls between+150oand-90ois abnormal and called superior right axis deviation.
-90o 180o 0o 90o RateRhythm Axis Intervals Hypertrophy Infarct • Causes of left axis deviation include: • Left ventricular hypertrophy • Inferior wall MI • Left bundle branch block • Left anterior fascicular block • Horizontal heart • Causes of right axis deviation include: • Right ventricular hypertrophy • Lateral wall MI • Right bundle branch block • Pulmonary hypertension • Vertical heart
QRS negative (R < Q+S) QRS equivocal (R = Q+S) RateRhythm Axis Intervals Hypertrophy Infarct We can quickly determine whether the QRS axis is normal by looking at leads I and II. If the QRS complex is overall positive (R > Q+S)in leads I and II, the QRS axis is normal. In this ECG what leads have QRS complexes that are negative? equivocal?
RateRhythm Axis Intervals Hypertrophy Infarct How do we know the axis is normal when the QRS complexes are positive in leads I and II?
-90o -60o -120o -150o -30o 180o 0o 30o 150o 60o 120o 90o RateRhythm Axis Intervals Hypertrophy Infarct The answer lies in the fact that each frontal lead corresponds to a location on the circle. • Limb leads • I = +0o • II = +60o • III = +120o avR avL I I • Augmented leads • avL = -30o • avF = +90o • avR = -150o II III II avF
-90o -60o -120o -150o -30o 180o 0o 30o 150o 60o 120o 90o RateRhythm Axis Intervals Hypertrophy Infarct Since lead I is orientated at 0o a wave of depolarization directed towards it will result in a positive QRS axis. Therefore any mean QRS vector between -90o and +90o will be positive. I
-90o -60o -120o -150o -30o 180o 0o 30o 150o 60o 120o 90o RateRhythm Axis Intervals Hypertrophy Infarct Since lead I is orientated at 0o a wave of depolarization directed towards it will result in a positive QRS axis. Therefore any mean QRS vector between -90o and +90o will be positive. Similarly, since lead II is orientated at 60o a wave of depolarization directed towards it will result in a positive QRS axis. Therefore any mean QRS vector between -30o and +150o will be positive. I II
-90o -60o -120o -150o -30o 180o 0o 30o 150o 60o 120o 90o RateRhythm Axis Intervals Hypertrophy Infarct Since lead I is orientated at 0o a wave of depolarization directed towards it will result in a positive QRS axis. Therefore any mean QRS vector between -90o and +90o will be positive. Similarly, since lead II is orientated at 60o a wave of depolarization directed towards it will result in a positive QRS axis. Therefore any mean QRS vector between -30o and +150o will be positive. I Therefore, if the QRS complex is positive in both leads I and II the QRS axis must be between -30o and 90o (where leads I and II overlap) and, as a result, the axis must be normal. II
-90o -90o -60o -60o -120o -120o -150o -150o -30o -30o 180o 180o 0o 0o 30o 30o 150o 150o 60o 60o 120o 120o 90o 90o RateRhythm Axis Intervals Hypertrophy Infarct Now using what you just learned fill in the following table. For example, if the QRS is positive in lead I and negative in lead II what is the QRS axis? (normal, left, right or right superior axis deviation) QRS Complexes III Axis + + normal + - left axis deviation I II
-90o -90o -60o -60o -120o -120o -150o -150o -30o -30o 180o 180o 0o 0o 30o 30o 150o 150o 60o 60o 120o 120o 90o 90o RateRhythm Axis Intervals Hypertrophy Infarct … if the QRS is negative in lead I and positive in lead II what is the QRS axis? (normal, left, right or right superior axis deviation) QRS Complexes III Axis + + normal + - left axis deviation I right axis deviation - + II
-90o -90o -60o -60o -120o -120o -150o -150o -30o -30o 180o 180o 0o 0o 30o 30o 150o 150o 60o 60o 120o 120o 90o 90o RateRhythm Axis Intervals Hypertrophy Infarct … if the QRS is negative in lead I and negative in lead II what is the QRS axis? (normal, left, right or right superior axis deviation) QRS Complexes I II Axis + + normal + - left axis deviation I right axis deviation - + - - right superior axis deviation II
RateRhythm Axis Intervals Hypertrophy Infarct Is the QRS axis normal in this ECG? No, there is left axis deviation. The QRS is positive in I and negative in II.
QRS Complexes I II Axis + + normal + - left axis deviation right axis deviation - + - - right superior axis deviation RateRhythm Axis Intervals Hypertrophy Infarct To summarize: • The normal QRS axis falls between -30o and +90o because ventricular depolarization is leftward and downward. • Left axis deviation occurs when the axis falls between -30o and -90o. • Right axis deviation occurs when the axis falls between +90o and +150o. • Right superior axis deviation occurs when the axis falls between between +150o and -90o. • A quick way to determine the QRS axis is to look at the QRS complexes in leads I and II.
SUMMARYRateRhythm Axis Intervals Hypertrophy Infarct To summarize VII a: • Calculate RATE • Determine RHYTHM • Determine QRS AXIS • Normal • Left axis deviation • Right axis deviation • Right superior axis deviation
SUMMARYRateRhythm Axis Intervals Hypertrophy Infarct In VII b we will cover the next 3 steps: • Calculate RATE • Determine RHYTHM • Determine QRS AXIS • Calculate INTERVALS • Assess for HYPERTROPHY • Look for evidence of INFARCTION
End of Module VII aReading 12-Lead ECGs Proceed to Module VII a Practice Quiz on your iROCKET Course