ECG Rhythm Interpretation
ECG Rhythm Interpretation. Module VI Advanced 12-Lead Interpretation. The 12-Lead ECG. The 12-Lead ECG contains a wealth of information. In Module V you learned that ST segment elevation in two leads is suggestive of an acute myocardial infarction. In this module we will cover:

ECG Rhythm Interpretation
E N D
Presentation Transcript
ECG Rhythm Interpretation Module VI Advanced 12-Lead Interpretation
The 12-Lead ECG The 12-Lead ECG contains a wealth of information. In Module V you learned that ST segment elevation in two leads is suggestive of an acute myocardial infarction. In this module we will cover: • ST Elevation and non-ST Elevation MIs • Left Ventricular Hypertrophy • Bundle Branch Blocks
ST Elevation and non-ST Elevation MIs • When myocardial blood supply is abruptly reduced or cut off to a region of the heart, a sequence of injurious events occur beginning with ischemia (inadequate tissue perfusion), followed by necrosis (infarction), and eventual fibrosis (scarring) if the blood supply isn't restored in an appropriate period of time. • The ECG changes over time with each of these events…
ST elevation & depression T-waves peaked flattened inverted Appearance of pathologic Q-waves ECG Changes Ways the ECG can change include:
ECG Changes & the Evolving MI There are two distinct patterns of ECG change depending if the infarction is: Non-ST Elevation ST Elevation • ST Elevation(Transmural orQ-wave), or • Non-ST Elevation (Subendocardialor non-Q-wave)
Ischemia Infarction Fibrosis ST Elevation Infarction The ECG changes seen with a ST elevation infarction are: ST depression, peaked T-waves, then T-wave inversion Before injury Normal ECG ST elevation & appearance of Q-waves ST segments and T-waves return to normal, but Q-waves persist
ST Elevation Infarction Here’s a diagram depicting an evolving infarction: A. Normal ECG prior to MI B. Ischemia from coronary artery occlusion results in ST depression (not shown) and peaked T-waves C. Infarction from ongoing ischemia results in marked ST elevation D/E. Ongoing infarction with appearance of pathologic Q-waves and T-wave inversion F. Fibrosis (months later) with persistent Q- waves, but normal ST segment and T- waves
ST Elevation Infarction Here’s an ECG of an inferior MI: Look at the inferior leads (II, III, aVF). Question: What ECG changes do you see? ST elevation and Q-waves Extra credit: What is the rhythm? Atrial fibrillation (irregularly irregular with narrow QRS)!
Non-ST Elevation Infarction Here’s an ECG of an inferior MI later in time: Now what do you see in the inferior leads? ST elevation, Q-waves and T-wave inversion
Ischemia Infarction Fibrosis Non-ST Elevation Infarction The ECG changes seen with a non-ST elevation infarction are: ST depression & T-wave inversion Before injury Normal ECG ST depression & T-wave inversion ST returns to baseline, but T-wave inversion persists
Non-ST Elevation Infarction Here’s an ECG of an evolving non-ST elevation MI: Note the ST depression and T-wave inversion in leads V2-V6. Question: What area of the heart is infarcting? Anterolateral
The QRS complexes are very tall (increased voltage) Left Ventricular Hypertrophy Compare these two 12-lead ECGs. What stands out as different with the second one? Normal Left Ventricular Hypertrophy Answer:
As the heart muscle wall thickens there is an increase in electrical forces moving through the myocardium resulting in increased QRS voltage. Increased QRS voltage Left Ventricular Hypertrophy Why is left ventricular hypertrophy characterized by tall QRS complexes? LVH ECHOcardiogram
Left Ventricular Hypertrophy • Criteria exists to diagnose LVH using a 12-lead ECG. • For example: • The R wave in V5 or V6 plus the S wave in V1 or V2 exceeds 35 mm. • However, for now, all you need to know is that the QRS voltage increases with LVH.
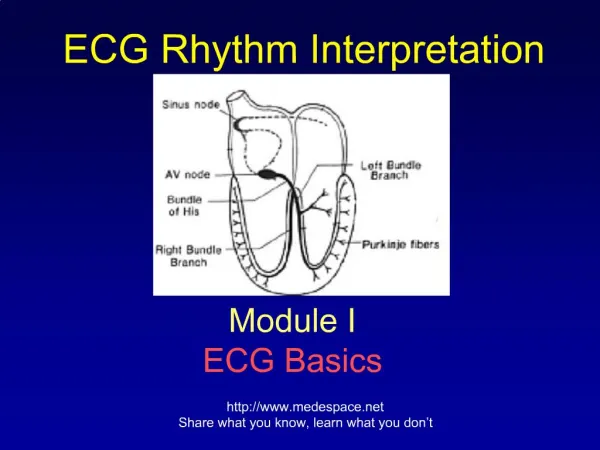
Bundle Branch Blocks Turning our attention to bundle branch blocks… • Remember normal impulse conduction is • SA node • AV node • Bundle of His Bundle Branches Purkinje fibers
Normal Impulse Conduction Sinoatrial node AV node Bundle of His Bundle Branches Purkinje fibers
Therefore, a conduction block of the Bundle Branches would be reflected as a change in the QRS complex. Right BBB Bundle Branch Blocks So, depolarization of the Bundle Branches and Purkinje fibers are seen as the QRS complex on the ECG.
Bundle Branch Blocks With Bundle Branch Blocks you will see two changes on the ECG. • QRS complex widens (> 0.12 sec). • QRS morphology changes (varies depending on ECG lead, and if it is a right vs. left bundle branch block).
When the conduction pathway is blocked it will take longer for the electrical signal to pass throughout the ventricles. Bundle Branch Blocks Why does the QRS complex widen?
For RBBB the wide QRS complex assumes a unique, virtually diagnostic shape in those leads overlying the right ventricle (V1 and V2). V1 “Rabbit Ears” Right Bundle Branch Blocks What QRS morphology is characteristic?
For LBBB the wide QRS complex assumes a characteristic change in shape in those leads opposite the left ventricle (right ventricular leads - V1 and V2). Broad, deep S waves Left Bundle Branch Blocks What QRS morphology is characteristic? Normal
Summary This Module introduced you to: • ST Elevation and Non-ST Elevation MIs • Left Ventricular Hypertrophy • Bundle Branch Blocks Don’t worry too much right now about trying to remember all the details. You’ll focus more on advanced ECG interpretation in your clinical years!