Comprehensive ECG Interpretation: A Systematic Approach to Diagnosing Cardiac Abnormalities
Join Dr. Shamim Nassrally, BSc (Hons), MB ChB, MRCP(UK), for an insightful session on ECG interpretation. By the end, you'll be equipped to systematically interpret ECGs and recognize key abnormalities including acute coronary syndrome, myocardial infarction, and various arrhythmias. This session covers essential components like heart rate, rhythm analysis, axis determination, and the identification of P waves, QRS complex, ST segment deviations, and T wave changes. Enhance your clinical skills and ensure accurate cardiac assessments.

Comprehensive ECG Interpretation: A Systematic Approach to Diagnosing Cardiac Abnormalities
E N D
Presentation Transcript
ECG interpretation Dr. Shamim Nassrally BSc (Hons) MB ChB MRCP(UK) Clinical Teaching Fellow
Objectives By the end of this session you should be able to: • Interpret ECGs using a systematic approach • Recognise important ECG abnormalities: • acute coronary syndrome • acute myocardial infarction • common arrhythmias.
Framework • Basic information/Demographics • Rate • Rhythm • Axis • P wave and PR interval • QRS complex • ST segment
Basic information • Identifying information: name/unit number • Date/time • Voltage (10mm/mV) • Speed (25mm/s)
Rate • 300/number large squares • Normal: 60-100bpm • <60 = bradycardia • >100 = tachycardia
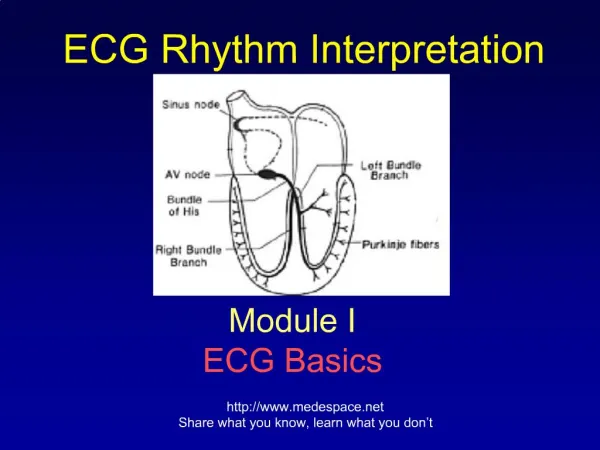
Rhythm • Are there P-waves? • Is each P followed by a QRS? • Is each QRS preceded by a P wave? • AF/atrial flutter • Supraventricular tachycardias • Heart block: • 1st degree • 2nd degree (Mobitz type 1 and type 2) • 3rd degree (complete heart block)
P wave and PR interval • Normal P wave <2.5mm high, <0.11s • Normal PR interval 0.12-0.2s (3-5 small squares)
Axis • I and II positive = normal axis • I positive + III negative = left axis deviation • I negative + III positive = right axis deviation
QRS complex • Normal QRS <0.12s (3 small squares) • LVH criteria • Wide QRS • Left bundle branch block • Right bundle branch block
ST segment • ST elevation: MI, left bundle branch block • ST depression: ischaemia, posterior MI, digoxin • T-wave: • Tall – hyperkalaemia, left bundle branch block • Flat – ischaemia, hypokalaemia
Quiz • Rate • Rhythm • P wave, PR interval • Axis • QRS complex • ST segment • T waves