Download
1 / 2
20 likes | 235 Vues
University of Houston. LH 1 –E 2. SL1, No LCM SL2, LCM SL3,LCM reduced strain. HH 1 –E 2. LH 1 –E 1. Fig. 1. A reconstructed 3D structure of the InAs/GaSb nanowire array. E 1 –E 2. +7. +6. +5. +4. +3. +2. +1. 0. -1. -2. -3. -4. -5.

E N D
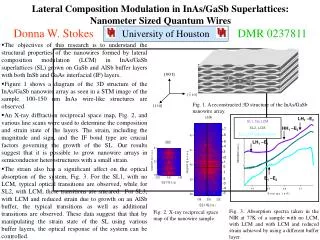
University of Houston LH1 –E2 SL1, No LCM SL2, LCM SL3,LCM reduced strain HH1 –E2 LH1 –E1 Fig. 1. A reconstructed 3D structure of the InAs/GaSb nanowire array. E1 –E2 +7 +6 +5 +4 +3 +2 +1 0 -1 -2 -3 -4 -5 Lateral Composition Modulation in InAs/GaSb Superlattices: Nanometer Sized Quantum WiresDonna W. StokesDMR 0237811 Fig. 3. Absorption spectra taken in the NIR at 77K of a sample with no LCM, with LCM and with LCM and reduced strain achieved by using a different buffer layer. Fig. 2. X-ray reciprocal space map of the nanowire sample.
University of Houston Lateral Composition Modulation in InAs/GaSb Superlattices: Nanometer Sized Quantum WiresDonna W. StokesDMR 0237811 Bear Brach Elementary students observed a magnet levitating over a superconductor during a tour of the PI’s laboratory. Ms. Cushenberry reviews statistical data with Dr. Stokes.