Download
1 / 63
720 likes | 1.05k Vues
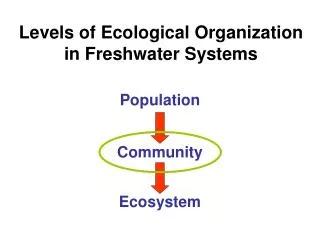
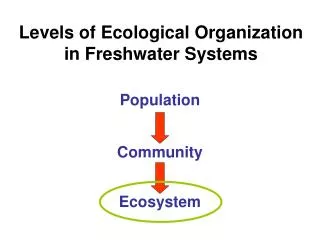
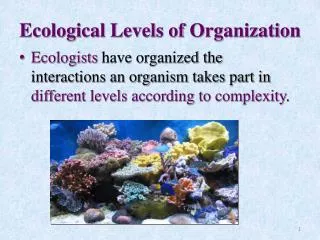
Levels of Ecological Organization in Freshwater Systems. Population. Community. Ecosystem. Lecture Goals To discuss basic controls on population size and population dynamics in freshwater systems.

E N D
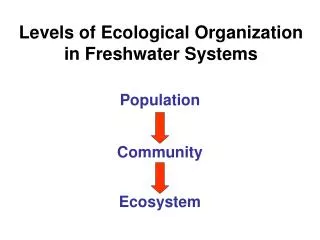
Levels of Ecological Organization in Freshwater Systems Population Community Ecosystem
Lecture Goals • To discuss basic controls on population size and population dynamics in freshwater systems. • To use the primary literature to explore specific mechanisms regulating population size and population dynamics in freshwater systems. Population Biology in Freshwater Systems
A group of interacting individuals of the same species in a particular place, at a particular time. What is a population? Population regulation: What determines the size of a population? Population dynamics: How does population size change over time?
A group of interacting individuals of the same species in a particular place, at a particular time.
A group of interacting individuals of the same species in a particular place, at a particular time.
The Fundamentals Nt+1 = Nt + B – D + I – E “spatial” “local”
Among ponds and lakes… Along streams and rivers… I and E
Lecture structure • Life history and Reproduction (B) • Mortality (D)
Lecture structure • Life history and Reproduction (B)
Life History: Changes experienced by an individual between birth and death that determine habitat requirements, ecology, and reproductive output.
Life History: Changes experienced by an individual between birth and death that determine habitat requirements, ecology, and reproductive output. Intrinsic differences in life history Extrinsic ecological factors acting on stages Variation in population size over space and time
Life history and Reproduction (B) Lecture structure > Reproductive strategies > Variation in vital rates with life history - Density dependence > Abiotic controls on life history
Life history and Reproduction (B) Lecture structure > Reproductive strategies
Reproductive Strategies • Semelparity: Reproduce once in lifetime, then die. • Iteroparity: Reproduce multiple times in lifetime.
Implications of Semelparity • To contribute to B, just need to survive to reproduce. • Females can invest everything they have in reproduction once they reach some “threshold”. • If reproduce in bad year, then fitness can go to 0 (i.e., all eggs in one basket). ***Dead bodies go right back into food web***
Implications of Iteroparity • To have a significant impact on B, need to survive to reproduce multiple times. • Current investment in reproduction may reduce future reproductive potential. • If reproduce in a bad year, then can still have high fitness over lifetime (i.e., eggs are in multiple baskets).
Fine-tuning Iteroparity Prop. of offspring over lifetime (Dubycha 2001)
Life history and Reproduction (B) Lecture structure > Reproductive strategies > Variation in vital rates with life history
Variation in vital rates with life history • Births • Stage (i.e., juvenile vs. adult) • Size
B and Stage VS. VS.
B and Size log Egg Number (Bruce 1978) log Snout-Vent Length
Variation in vital rates over life history • Births • Deaths • Age (i.e., senescence) • Stage / Size
Embeddedness Brook Trout Stage-specific effects on D Larvae Adults Gyrinophilus Adults (Lowe et al. 2004)
Variation in vital rates over life history • Births • Deaths • Dispersal • Stage • Size
The colonization cycle of • freshwater insects
What is the demographic importance of drifters? > “Excess” individuals > Low-fitness individuals
Dispersal and Drift 15N (MacNeale et al. 2005)
15N (MacNeale et al. 2005)
Sticky Traps (MacNeale et al. 2005)
Life history and Reproduction (B) Lecture structure > Reproductive strategies > Variation in vital rates with life history - Density dependence
Density Dependent Recruitment • Brown trout (Salmo trutta) in two streams in UK • Egg density ≈ Density of reproductive adults • May depend on range of observations (Elliott 1987)
Life history and Reproduction (B) Lecture structure > Reproductive strategies > Variation in vital rates with life history - Density dependence > Abiotic controls on life history
Abiotic controls on life history • Broader implications • Mediates exposure to other factors (e.g., predators) • Regulates how closely a population can track resources • Affects the rate at which populations can respond to natural selection
Lecture structure • Life history and Reproduction (B) • Mortality (D)
Drying of ephemeral pools and streams • Flooding and bed movement • Rapid changes in chemical or physical conditions • Predation • Others… Important controls on mortality in freshwater systems
Prey mortality Prey mortality Prey density Predator density The “rules”: Predation in freshwater systems …but there are important and interesting exceptions to this rule that have been shown in studies of freshwater organisms.
Predator functional response • Interactions among predators • Prey refuges Predation in freshwater systems
Predator functional response Predation in freshwater systems
Prey mortality Prey density How does predation rate (or prey mortality) change with prey density? Predator functional response
How does predation rate (or prey mortality) change with prey density? Time spent searching for prey Predator functional response Predation Rate Time spent “handling” prey
Predator functional response (Begon et al. 1990)
Broader implications • Even at high predator densities, prey mortality is limited by handling time. • There will always be a maximum predation rate that prey can offset with reproduction. • Creates the opportunity for predator swamping. Predator functional response