Assessing Technology tradeoffs for 65nm logic circuits
220 likes | 456 Vues
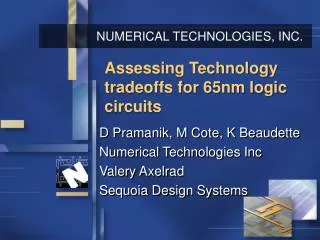
Assessing Technology tradeoffs for 65nm logic circuits. D Pramanik, M Cote, K Beaudette Numerical Technologies Inc Valery Axelrad Sequoia Design Systems. INTRODUCTION. At the 65nm node interaction between process and design can lead to manufacturability crisis

Assessing Technology tradeoffs for 65nm logic circuits
E N D
Presentation Transcript
Assessing Technology tradeoffs for 65nm logic circuits D Pramanik, M Cote, K Beaudette Numerical Technologies Inc Valery Axelrad Sequoia Design Systems
INTRODUCTION • At the 65nm node interaction between process and design can lead to manufacturability crisis • Methodology for assessing tradeoffs between device, circuit and process limits • Use simulation tools to investigate different scenarios for optimum tradeoffs • Electrical and Physical simulations
Technology variants • Every Technology node has variants to address different market segment needs • Transistors with different parameters are offered based on application needs • Device specifications should drive manufacturability requirements that impact overall costs • One size does not fit all !!
High Volume Market segments • Low Power (Cellphones/PDA) • Low operating voltage(<1V) • Low operating frequency (<200MHz) • High density • Low active and standby current • Low cost • High Performance (PC/Server/Graphics ) • Nominal operating voltage • High operating frequency (>2GHz) • High density
MOSFET Technology Elements Row Cell Block Chip
Design flow Device Simulation Design rules Architectural Design Device Models OPC Phase Shifting Functional specs Silicon Simulation RTL design SubW Libs. Silicon Verification Silicon Verification Synthesis Floorplanning Place and route LVS, DRC, Extract OPC Final Analysis & Verification Phase Shifting Silicon Verification
Key formulas • Device • Ion = vsatW Cox(Vdd - Vdsat) Vdsat when L • Ioff = 10 -6exp(-Vth/S) where S= 80mV/decade • Lithography • Min Pitch = k1l/NA • DOF = k2l/NA2 • Circuit • Delay time = ClVdd/Ion; Cl - avg load capacitance • Dynamic power =nClVdd2f n - avg number of switching events • Vdd - Supply Voltage • L - Gate length • W - Gate width • Cox- Gate capacitance • Vth - Threshold voltage • Ion - Fully on current • Ioff - Off state current
Device simulation Electrical Parameters • Vdd - Supply Voltage • L - Gate length • W - Gate width • tox- Oxide thickness • xj – Junction depth • Ion - Fully on current • Ioff - Off state current L Gate Spacer tox xj Source Drain Transistor cross-section
Lo Pwr Hi Perf Device Characteristics Ion vs Ioff characteristics for device technology Gate oxide Lo Pwr - 16AHi Perf - 13A Hi Perf Lo Pwr Off state leakage vs Gate length for both device technologies
65nm Active Electrical criteria Aerial Image contours overlaid on drawn features showing CD variation along length of gate. CD at listed sites shown in table. Avg CD (excluding 4) = 61nm Use OPC to bring avg CD back to 65nm
Cell generation • Technology file -process design rules and recommended rules • Define architecture (cell height, power rails etc) • Input circuit netlist • Cell placed, routed and compacted • View completed cell and if necessary modify, layout and re-compact
Same function ;Different Drive And 2X0 And 2X4
Cell placement & Circuit Timing ti tg A B Timing delay between A and B is the sum of delays through individual cells(tg) and across interconnects (ti)
Lithography choices with 193nm Layout Att PSM Strong Phase shift NA 0.85 OAI Best contrast and DOF with Strong Phase shift
FullPhase layer generation Original Active and Poly layers Trim layer Phase shift layers
Aerial Image using 193nm NA = 0.75; sigma=0.4; dose = 1X NA = 0.75; sigma=0.4; dose = 3X
Manufacturability analysis Analysis of simulated images show following areas of improvement • Process • Improved Depth of Focus (DOF) by changing poly pitch from 160nm to 180nm • Better CD control - less OPC • Electrical • Poly contact pads shrink substantially leading to high contact resistance. • Poly-contact overlap improved by going to larger contacts and larger poly extensions
Impact of Design rules Poly pitch – 160nm Contacts – 80nm Contact extension – 35nm Poly pitch – 180nm Contacts – 90nm Contact extension – 45nm
Simulation of new cells Defocus 0nm Cell with larger poly pitch and larger contact pads Defocus 100nm
Summary • Simulation of device characteristics allow the circuit impact of lithography variations to be assessed • Strong Alt PSM needed for printing poly features using 193nm • Automated layout tools allow tradeoff between layout design rules , circuit density and manufacturability