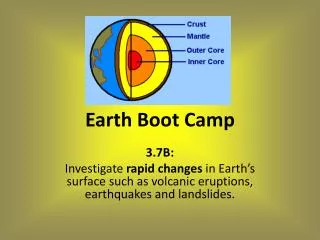
Technology Boot Camp, Module 5 Skills Update D
100 likes | 238 Vues
Technology Boot Camp, Module 5 Skills Update D. Zachary Taylor EDTL 6310 Bowling Green State University. Creating Charts in Excel. This week I focused on collecting independent research that I will use in my final project.

Technology Boot Camp, Module 5 Skills Update D
E N D
Presentation Transcript
Technology Boot Camp, Module 5Skills Update D Zachary Taylor EDTL 6310 Bowling Green State University
Creating Charts in Excel • This week I focused on collecting independent research that I will use in my final project. • I surveyed every single one of my students and asked them three questions: • Would you agreed to have all of your classwork graded by a computer? • Would you pay more in tuition to have your work graded by a human? • How important is face-to-face feedback from a teacher? (Highest importance, Important, Not Important, Depends on Assignment)
Creating Charts in Excel • I then compiled the data and created charts in Excel that I will insert into my final project. • First, I entered the data into the cells.
Entering Formulas in Excel • Then, I entered a formula that would provide me the sum of my two data cells. • Then, I entered a formula that would only add the data that I wanted the formula to add.
Entering Formulas in Excel • Here is what all three of my data sets look like after I entered the formulas I needed.
Creating Tables in Excel • I then created a table from the data I entered by using the INSERT and PIE CHART functions in the program.
Creating Tables in Excel • This action produced a simple pie chart that is accurate, functional, and easy to interpret: perfect for my seminar. • All I need to do now is repeat the process with the other charts, and then label the charts.
Creating Tables in Excel • This action produced a simple pie chart: I changed a few of the display options and this pie chart is now perfect for my final project. • All I need to do now is repeat the process with the other charts, and then label the charts. • Here is an example of one of my charts.
Creating Tables in Excel • Here are my three finished charts that will be incorporated into my final project presentation to my fellow English teachers.
Thus Concludes Module 5… • This module was especially beneficial as all of the skills I honed in this module were used in the compiling of materials for my final project! • My updated technology skills checklist is inserted into the post on my blog! • -Zachary Taylor