Download
1 / 39
390 likes | 508 Vues
Inferences on Population Proportions. Use Calculation from Sample to Estimate Population Parameter. (select). Population. Sample. (calculate). (describes). (estimate). Parameter. Statistic. Describes a sample. Always known Changes upon repeated sampling. Examples:.

E N D
Use Calculation from Sample to Estimate Population Parameter (select) Population Sample (calculate) (describes) (estimate) Parameter Statistic G. baker, Department of Statistics University of South Carolina; Slide 2
Describes a sample. Always known Changes upon repeated sampling. Examples: Describes a population. Usually unknown Is fixed Examples: Statistic Parameter G. baker, Department of Statistics University of South Carolina; Slide 3
A Statistic is a Random Variable • Upon repeated sampling of the same population, the value of a statistic changes variable. • While we don’t know what the next sample will yield, we do know the overall pattern over many, many samplings random. • The distribution of possible values of a statistic for repeated samples of the same size from a population is called the sampling distribution of the statistic. G. baker, Department of Statistics University of South Carolina; Slide 4
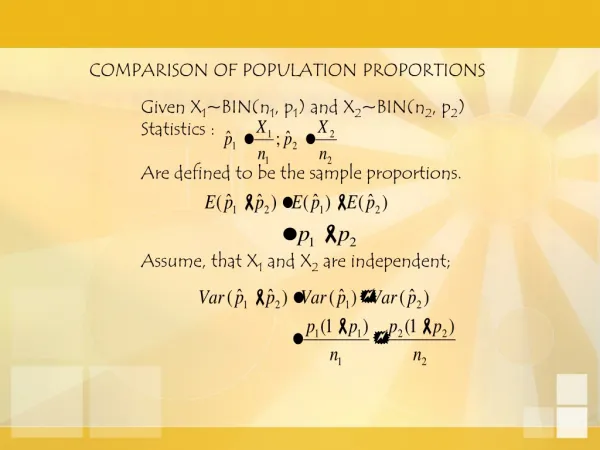
Proportion • We are interested in the distribution of • Note, is cY where c = 1/n is a constant and Y is a binomial random variable. • If Y is normally distributed, cY will also be normally distributed. G. baker, Department of Statistics University of South Carolina; Slide 5
If Y is normal cY is normal y cy 0.5y For example: If Y is n(µ=100,σ2=4), then (0.5)Y is n(µ=50, σ2=1) G. baker, Department of Statistics University of South Carolina; Slide 6
Distribution of Sample Proportions A normal curve can be used to approximate the distribution of sample proportions if: The size of the sample or number of repetitions is relatively large (say 50 or more). While the sample size is relatively small compared to the population size (say < 10%) G. baker, Department of Statistics University of South Carolina; Slide 7
Sampling Distribution for The sampling distribution of based on large n is approximately normal. Rule of Thumb: If np > 5 and n(1-p) > 5 (preferably both > 10), then the distribution of Y and hence Y/n can be approximated with a normal distribution. G. baker, Department of Statistics University of South Carolina; Slide 8
Sampling Distribution for To completely define the normal distribution of We need the mean (expected value) and variance. G. baker, Department of Statistics University of South Carolina; Slide 9
Sampling Distribution of 1-α p So, at most, will be away from p, (1-α)100% of the time. We call this (1-α)100% the level of confidence. G. baker, Department of Statistics University of South Carolina; Slide 10
Repeated Sampling of Size n 95% 95% of the time our estimate will be within of the truth. G. baker, Department of Statistics University of South Carolina; Slide 11
Standard Error • We don’t know the value of p, so we will use • When we use , we have an estimate of the standard deviation for the sampling distribution of . • We call this estimate the standard error. G. baker, Department of Statistics University of South Carolina; Slide 12
Confidence Interval for p Example: G. baker, Department of Statistics University of South Carolina; Slide 13
Confidence Interval Based on Normal Distribution Standard error is our estimate of the standard deviation for the distribution of the point estimate. G. baker, Department of Statistics University of South Carolina; Slide 14
Confidence Interval Estimation • Airplanes approaching a runway for a landing are required to stay within the localizer (certain distance left and right of the runway). When an airplane deviates from the localizer, it is called an exceedence. • Suppose in a random sample of 250 landings for a certain airline, 30 exceed the runway. Estimate the percentage of exceedences with a 95% confidence interval. With a 99% confidence interval. G. baker, Department of Statistics University of South Carolina; Slide 15
Effect of Level of Confidence on a Confidence Interval • For a given sample size, as one increases the level of confidence, what happens to the width of the confidence interval? • What is the consequence of this change in interval width? G. baker, Department of Statistics University of South Carolina; Slide 16
Effect of Sample Size on a Confidence Interval • At a given level of confidence, as one increases the sample size what happens to the width of the confidence interval? • So choose your sample size before you estimate a proportion with a confidence interval G. baker, Department of Statistics University of South Carolina; Slide 17
Sample Size (solving for n) G. baker, Department of Statistics University of South Carolina; Slide 18
Sample Size • If you can’t guess a value for : • What sample size would you recommend to estimate the proportion of exeedences with a 95% confidence interval and maximum error of 2%? G. baker, Department of Statistics University of South Carolina; Slide 19
Research Update! • Recent research shows that we get better coverage for (1-α)100% CI’s on p-hat if we alter the CI formula. • 95%CI: where (Agresti/Coull) G. baker, Department of Statistics University of South Carolina; Slide 20
Statistical Hypothesis • A statistical hypothesis is an assertion or conjecture concerning one or more population parameters. • Examples: • More than 7% of the landings for a certain airline exceed the runway. • The defective rate on a manufacturing line is less than 10%. • Our percentage of sales outside the United States is no longer 25%. G. baker, Department of Statistics University of South Carolina; Slide 21
The Null and Alternative Hypotheses • Null Hypothesis, Ho, represents what we assume to be true. It is always stated so as to specify an exact value of the parameter. • Alternative (Research) Hypothesis, H1 or Ha, represents the alternative to the null hypothesis and allows for the possibility of several values. It carries the burden of proof. • In most situations, the researcher hopes to disprove or reject the null hypothesis in favor of the alternative hypothesis. G. baker, Department of Statistics University of South Carolina; Slide 22
Airline Exceedences Our research (alternative) hypothesis is that more than 7% of the landings for a certain airline exceed the runway. Suppose in a random sample of 250 landings for a certain airline, 30 exceed the runway. Let p = proportion exceeding runway H0: p = 0.07 (equal to 7%) Ha: p > 0.07 (more than 7%) G. baker, Department of Statistics University of South Carolina; Slide 23
Null and Alternative Hypotheses • We are trying to demonstrate that the defective rate on a manufacturing line is less than 10%. • We want to demonstrate that our percentage of sales outside the United States is no longer 25%. G. baker, Department of Statistics University of South Carolina; Slide 24
Steps to a Hypothesis Test • Determine the null and alternative hypotheses. • Collect data and calculate test statistic, assuming null hypothesis it true. • Assuming the null hypothesis is true, calculate the p-value. • Draw conclusion based on p-value. G. baker, Department of Statistics University of South Carolina; Slide 25
Test Statistic Based on Normal Distribution G. baker, Department of Statistics University of South Carolina; Slide 26
Hypothesis Test H0: p =0.07 Ha: p > 0.07 <0.005 Z 3 G. baker, Department of Statistics University of South Carolina; Slide 27
P-value • The p-value is the probability of getting the sample results you got or something more extreme assuming that the null hypothesis is true. • If the p-value is small, we question the null hypothesis and find in favor of the alternative hypothesis. • If the p-value is large, there is no reason to question the null hypothesis, we will continue to assume that it is true. • In this example p-value < 0.005 G. baker, Department of Statistics University of South Carolina; Slide 28
Conclusion • Since the p-value is small (<0.005), we will find in favor of the alternative hypothesis and conclude that the exceedence rate is more than 7%. G. baker, Department of Statistics University of South Carolina; Slide 29
Alpha: Level of Significance • In reference to the p-value, what do we mean by “small”? • We define “small” by setting the alpha value ahead of time. • If we set alpha to 0.05 p-value < 0.05 find for alternative hypothesis p-value > 0.05 continue to assume the null hypothesis G. baker, Department of Statistics University of South Carolina; Slide 30
Alpha: Level of Significance 0.05 Z 1.645 3 H0 Ha At 0.05 level of significance there is sufficient evidence to conclude p > 0.07 G. baker, Department of Statistics University of South Carolina; Slide 31
Exceedence of the Localizer • Airplanes approaching a runway for a landing are required to stay within the localizer (certain distance left and right of the runway). When an airplane deviates from the localizer, it is called an exceedence. Historically a given airline has experienced 12% exceedence at a certain airport. In an effort to improve the exceedence, pilots went through a new training program. After the program, a random sample of 250 landings at the airport found 20 in exceedence. Can we conclude that the training was successful? G. baker, Department of Statistics University of South Carolina; Slide 32
Was the Airline Successful in Reducing the Exceedence Rate? • Confidence Interval Approach: We are 95% confident that the exceedence rate is between 0.0464 and 0.1136. G. baker, Department of Statistics University of South Carolina; Slide 33
Was the Airline Successful in Reducing the Exceedence Rate? • Hypothesis Test Approach: H0: p = 0.12 Ha: p < 0.12 0.05 α = 0.05 Z -1.645 Reject H0 Fail to Reject H0 G. baker, Department of Statistics University of South Carolina; Slide 34
Our Conclusion? At 0.05 level of significance • There is sufficient evidence to conclude p < 0.12. • There is insufficient evidence to conclude p < 0.12. • There is sufficient evidence to conclude p > 0.12 • There is insufficient evidence to conclude p > 0.12 G. baker, Department of Statistics University of South Carolina; Slide 35
p-value Probability of getting the test statistic we got or something more extreme given H0 is true. 0.0258 -2 -1 0 Z -1.9462 G. baker, Department of Statistics University of South Carolina; Slide 36
One Last Time! • Airplanes approaching a runway for a landing are required to stay within the localizer (certain distance left and right of the runway). When an airplane deviates from the localizer, it is called an exceedence. Historically a given airline has experienced 12% exceedence at a certain airport. After major renovations to the runway a random sample of 250 landings had 35 exceedences. Is there reason to think that the exceedence rate has changed? G. baker, Department of Statistics University of South Carolina; Slide 37
H0: Ha: α = 0.05 Z = p-value = 0.025 0.025 -1.96 +1.96 Ha Ha H0 G. baker, Department of Statistics University of South Carolina; Slide 38
Given population parameter p and test value p0: For H0: p = p0 Ha: p p0 Ha: p > p0 Ha:p < p0 α/2 α/2 Ha H0 Ha α H0 Ha α G. baker, Department of Statistics University of South Carolina; Slide 39 Ha H0