Download
1 / 19
230 likes | 828 Vues
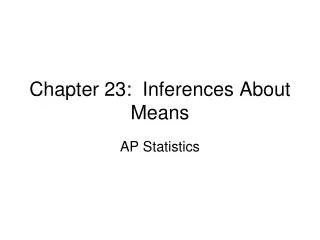
Chapter 11 Inferences About Population Variances. Inference about a Population Variance. Inferences about Two Population Variances. Inferences About a Population Variance. Chi-Square Distribution Interval Estimation Hypothesis Testing. Chi-Square Distribution.

E N D
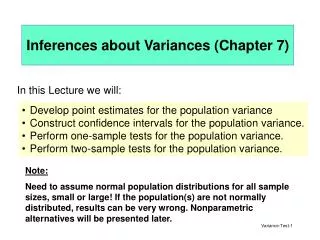
Chapter 11 Inferences About Population Variances • Inference about a Population Variance • Inferences about Two Population Variances
Inferences About a Population Variance • Chi-Square Distribution • Interval Estimation • Hypothesis Testing
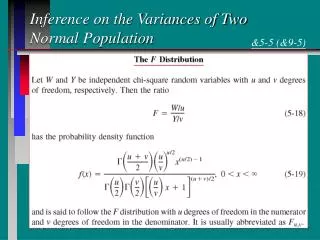
Chi-Square Distribution • The chi-square distributionis the sum of squared standardized normal random variables such as (z1)2+(z2)2+(z3)2 and so on. • The chi-square distribution is based on sampling • from a normal population. • The sampling distribution of (n - 1)s2/ 2 has a chi- square distribution whenever a simple random sample of size n is selected from a normal population. • We can use the chi-square distribution to develop • interval estimates and conduct hypothesis tests • about a population variance.
Examples of Sampling Distribution of (n - 1)s2/ 2 With 2 degrees of freedom With 5 degrees of freedom With 10 degrees of freedom 0
We will use the notation to denote the value for the chi-square distribution that provides an area of a to the right of the stated value. Chi-Square Distribution • For example, there is a .95 probability of obtaining a c2 (chi-square) value such that
Interval Estimation of 2 .025 .025 95% of the possible 2 values 2 0
Interval Estimation of 2 • There is a (1 – a) probability of obtaining a c2 value such that • Substituting (n – 1)s2/s 2 for the c2 we get • Performing algebraic manipulation we get
Interval Estimation of 2 • Interval Estimate of a Population Variance where the values are based on a chi-square distribution with n - 1 degrees of freedom and where 1 - is the confidence coefficient.
Interval Estimation of • Interval Estimate of a Population Standard Deviation Taking the square root of the upper and lower limits of the variance interval provides the confidence interval for the population standard deviation.
where is the hypothesized value for the population variance Hypothesis TestingAbout a Population Variance • Left-Tailed Test • Hypotheses • Test Statistic
Reject H0 if where is based on a chi-square distribution with n - 1 d.f. Hypothesis TestingAbout a Population Variance • Left-Tailed Test (continued) • Rejection Rule Critical value approach: Reject H0 if p-value <a p-Value approach:
where is the hypothesized value for the population variance Hypothesis TestingAbout a Population Variance • Right-Tailed Test • Hypotheses • Test Statistic
Reject H0 if where is based on a chi-square distribution with n - 1 d.f. Hypothesis TestingAbout a Population Variance • Right-Tailed Test (continued) • Rejection Rule Critical value approach: Reject H0 if p-value <a p-Value approach:
where is the hypothesized value for the population variance Hypothesis TestingAbout a Population Variance • Two-Tailed Test • Hypotheses • Test Statistic
Reject H0 if where are based on a chi-square distribution with n - 1 d.f. Hypothesis TestingAbout a Population Variance • Two-Tailed Test (continued) • Rejection Rule Critical value approach: p-Value approach: Reject H0 if p-value <a
Hypothesis Testing About theVariances of Two Populations • One-Tailed Test • Hypotheses Denote the population providing the larger sample variance as population 1. • Test Statistic
Hypothesis Testing About theVariances of Two Populations • One-Tailed Test (continued) • Rejection Rule Critical value approach: Reject H0 if F>F where the value of Fis based on an F distribution with n1 - 1 (numerator) and n2 - 1 (denominator) d.f. Reject H0 if p-value <a p-Value approach:
Hypothesis Testing About theVariances of Two Populations • Two-Tailed Test • Hypotheses Denote the population providing the larger sample variance as population 1. • Test Statistic
Hypothesis Testing About theVariances of Two Populations • Two-Tailed Test (continued) • Rejection Rule Critical value approach: Reject H0 if F>F/2 where the value of F/2 is based on an F distribution with n1 - 1 (numerator) and n2 - 1 (denominator) d.f. Reject H0 if p-value <a p-Value approach: