Download
1 / 15
150 likes | 290 Vues
Inferences about the regression line. (Session 03). Learning Objectives. At the end of this session, you will be able to make inferences concerning the slope of the regression line through the use of a t-test using an analysis of variance F-test

E N D
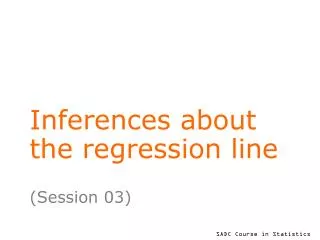
Inferences about the regression line (Session 03)
Learning Objectives At the end of this session, you will be able to • make inferences concerning the slope of the regression line • through the use of a t-test • using an analysis of variance F-test • describe and interpret the components of an anova table • explain the meaning of s2 in the analysis of variance and the importance of attention to the corresponding degrees of freedom
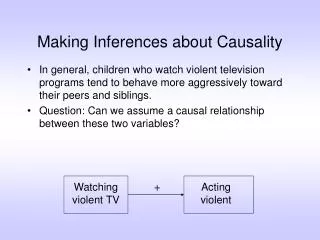
Smoking and death rates again! We consider again the example used in the previous session concerning the average number of cigarettes smoked per adult in 1930 and the death rate per million in 1952 for sixteen countries. Previously we described this relationship. We now ask whether this relationship is a real one, or whether it could be just a chance occurrence.
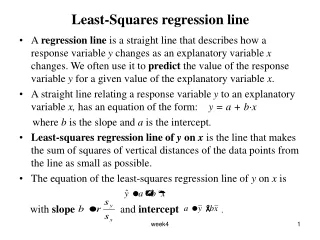
Recall model estimates ------------------------------------------------------ deathrate|Coef. Std.Err. t P>|t| [95% Conf.Int.] ---------+-------------------------------------------- cigars | .2410 .0544 4.43 0.001 .1245 .3577 const. | 28.31 46.92 0.60 0.556 -72.34 128.95 ------------------------------------------------------ Estimatesandof unknown parameters and of the model y = + x + Estimated equation is: = 28.31 + 0.241 * x
Assessing the regression line Is there a real relationship between y and x? In the model y = +x, need to test the hypothesis: H0: no linear relationship, i.e. slope = 0 H1: y is linearly related to x, i.e. slope 0 One approach is to use a t-test, i.e. first calculate t below. (Same as t-value for “cigars” in slide 4)
Interpreting results about the slope Compare calculated t of 4.43 with tabulated t-value with 14 d.f. The 2-sided tabulated value is 2.98 at a 1% significance level, and 4.14 at a 0.1% sig. level. It may be concluded that there is strong evidence to reject the null hypothesis H0. i.e. there is strong evidence of a linear relationship between smoking and death rates. Note: In practice, just the computer output P>|t| , will be interpreted. This is the p-value for the test.
Another approach… • The same hypothesis as above can also be • tested using an analysis of variance (ANOVA) • This involves splitting the overall variation in • y into two components: • Variation due to the regression, i.e. due to the presence of the explanatory variable x • Balance (or residual) variation, i.e. variation that is not explained by the explanatory variable
Deviations from overall mean Deviation from mean Mean=215
Deviations from regression and residual deviation Residual deviation Deviation from regression
Analysis of Variance (ANOVA) • ANOVA shows breakdown of total variation into • Variation due to regression, and • Residual variation
Analysis of Variance (ANOVA) ctd… • Mean square (M.S.)=Sum of squares (S.S.) • degrees of freedom(d.f.) • Need sufficient d.f. for residual M.S. for reliable significance testing • Regression has 1 d.f. because 1 slope is being estimated
Interpretation Residual Mean Square • Residual Mean Square (s2) estimates the underlying variation (2) in y that is not explained by the x variable • It is used in the calculation of standard errors of model estimates (& other estimates derived from the model) • Hence it plays a role in determining the precision of such estimates • For a simple linear regression model, the residual degrees of freedom = n – 2.
Interpretation of Anova table Significance test: H0: no linear relationship between death rate and number of cigarettes smoked (=0) H1: there is a linear relationship (0) • F-value of 19.7 • Compare with F-distribution with (1,14) df • Highly significant: p-value=0.0006 Conclusion: there is a strong evidence of a linear relationship between death rates and number of cigarettes smoked.
ANOVA versus t-test In our example, anova and t-test were testing the same hypothesis, so conclusions identical! However, note that • the anova can be extended to include more than one regressor variable • The t-test can be used to test general hypotheses concerning the slope, e.g. H0: slope=1 for testing if a new, simpler poverty index behaves similarly to a standard measure previously used.
Practical work follows to ensure learning objectives are achieved…