Another Regression Line
Another Regression Line. Statistics 1. EDEXCEL. The reason we had to keep using the phrase “ y on x ” is that there are two regression lines. e.g. If we had we used. So far, we have calculated the regression line for y on x.

Another Regression Line
E N D
Presentation Transcript
Statistics 1 EDEXCEL
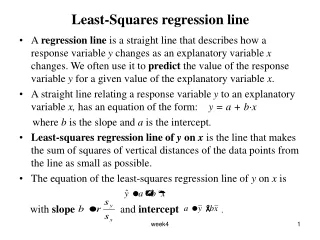
The reason we had to keep using the phrase “ y on x ” is that there are two regression lines. e.g. If we had we used So far, we have calculated the regression line for y on x. If we want to estimate x for a given y, we use the x on y regression line. It may seem strange to have 2 regression lines depending on which quantity we want to estimate. Previously, in Pure Maths, if we wanted to find x for a given y we just turned the equation around. However, in Statistics we have data spread around a line and we want to estimate with as little uncertainty as possible.
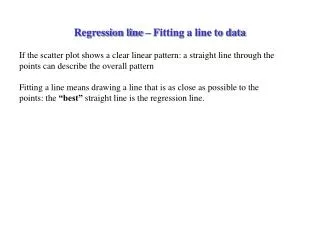
The sum of the squares of these lengths is made as small as possible. For the height and foot length data that we used before, the x on y regression line is given by
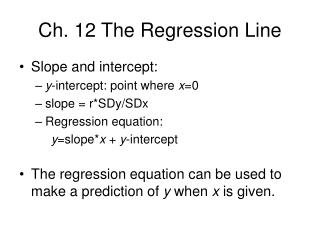
Foot length and height of UK children y on x regression line Foot length (cm) This point,the point of intersection of the lines, is the mean x on y regression line Height (cm) y on x regression line: x on y regression line: So, the two regression lines are If the length of a child’s foot was 20cm we would use the x on y regression line to estimate the child’s height.
For y on x we had where and where We can easily adapt the previous calculations in order to find the least squares regression line for x on y: Swapping x and y gives
e.g. The following data gives the weights and lengths of a sample of beans: Weight (g) 0·7 1·2 0·9 1·4 1·2 1·1 1·0 0·9 1·0 0·8 Length (cm) 1·7 2·2 2·0 2·3 2·4 2·2 2·0 1·9 2·1 1·6 Source: O.N.Bishop (a) Taking the weight to be x and length as y, calculate both least squares regression lines. (b) Use the appropriate line to estimate the weight of a bean of length 1·5 cm. (c) Comment on your answer to (b). (a) Using the calculator functions for the y on x regression line, Solution:
Weight (g) 0·7 1·2 0·9 1·4 1·2 1·1 1·0 0·9 1·0 0·8 Length (cm) 1·7 2·2 2·0 2·3 2·4 2·2 2·0 1·9 2·1 1·6 If your calculator doesn’t give the constants for the x on y line, then use the formula booklet as follows: Summary data:
Weight (g) 0·7 1·2 0·9 1·4 1·2 1·1 1·0 0·9 1·0 0·8 Length (cm) 1·7 2·2 2·0 2·3 2·4 2·2 2·0 1·9 2·1 1·6 Summary data:
Weight (g) 0·7 1·2 0·9 1·4 1·2 1·1 1·0 0·9 1·0 0·8 Length (cm) 1·7 2·2 2·0 2·3 2·4 2·2 2·0 1·9 2·1 1·6 Summary data:
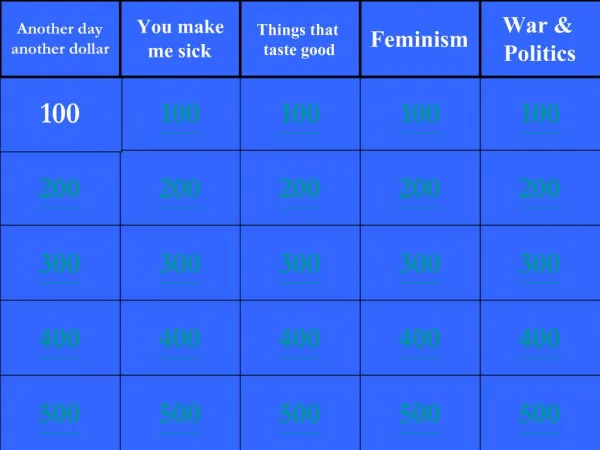
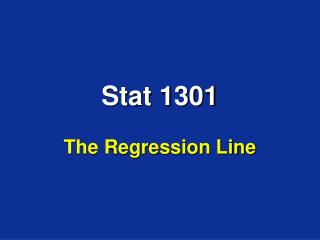
Weight and Length of beans ( x on y ) ( y on x ) The two regression lines look like this:
Weight (g) 0·7 1·2 0·9 1·4 1·2 1·1 1·0 0·9 1·0 0·8 Length (cm) 1·7 2·2 2·0 2·3 2·4 2·2 2·0 1·9 2·1 1·6 ( x on y ) ( y on x ) The answer is unreliable as the values lie outside the range of the data. (b) Use the appropriate line to estimate the weight of a bean of length 1·5 cm. We are given y and want to find x so we use the x on y regression line: (c) Comment on your answer to (b).
Both regression lines pass through the mean, SUMMARY There are 2 regression lines: • The y on x regression line is used to estimate y for a given x. • The x on y regression line is used to estimate x for a given y. • If the data have a high degree of scatter, the regression lines are further apart than for closely clustered data. • For data lying entirely on a line, the 2 regression lines coincide.
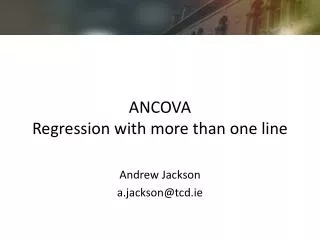
1. The following summary data relates to the population of woodland birds (x) and farmland birds (y) between 1970 and 2002 ( 33 years ). The index for both was taken as 100 in 1970. Source: Social Trends ( from Br. Trust for Ornithology and RSPB ) Summary data: Exercise Find the equation of the x on y regression line.
The x on y regression line is given by Solution:
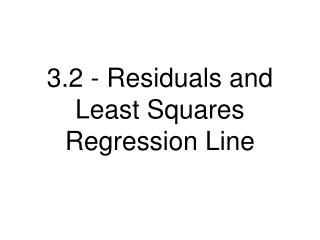
Data for 1970 Data for 2002 The full data set together with the x on y regression line looks like this: What do you notice about the data? ANS: Low levels of farmland species occur with low levels of woodland species. ( This doesn’t mean that one causes the other. They could both, for example, be linked to availability of food. ) Only 2 dates are shown but they suggest that both types have declined.
The following slides contain repeats of information on earlier slides, shown without colour, so that they can be printed and photocopied. For most purposes the slides can be printed as “Handouts” with up to 6 slides per sheet.
SUMMARY There are 2 regression lines: • The y on x regression line is used to estimate y for a given x. • The x on y regression line is used to estimate x for a given y. • If the data have a high degree of scatter, the regression lines are further apart than for closely clustered data. • For data lying entirely on a line, the 2 regression lines coincide. • Both regression lines pass through the mean,
For the height and foot length data that we used before, the x on y regression line is given by The sum of the squares of these lengths is made as small as possible.
We can easily adapt the previous calculations in order to find the least squares regression line for x on y: For y on x we had where and Swapping x and y gives where
e.g. The following data gives the weights and lengths of a sample of beans: Weight (g) 0·7 1·2 0·9 1·4 1·2 1·1 1·0 0·9 1·0 0·8 Length (cm) 1·7 2·2 2·0 2·3 2·4 2·2 2·0 1·9 2·1 1·6 Source: O.N.Bishop (a) Taking the weight to be x and length as y, calculate both least squares regression lines. (b) Use the appropriate line to estimate the weight of a bean of length 1·5 cm. (c) Comment on your answer to (b). (a) Using the calculator functions for the y on x regression line, Solution:
If your calculator doesn’t give the constants for the x on y line, then use the formula booklet as follows: Summary data:
(b) We are given y and want to find x so we use the x on y regression line: (c) The answer is unreliable as the values lie outside the range of the data.