ProteoRed Multicentric Experiment 5 2D electrophoresis analysis
130 likes | 250 Vues
This report details a multicentric experiment conducted in Salamanca on March 16-17, 2010, focusing on the analysis of a mixture of approximately 150 E. coli proteins using 2D electrophoresis. The experiment also involved spiking samples with four mammalian proteins at varying concentrations. Quantitative analysis of the spiked proteins was performed using advanced gel imaging techniques and statistical testing. Data and protocols from this experiment are available from involved centers including HUVH and CIMA, contributing to the understanding of protein interactions and methodologies.

ProteoRed Multicentric Experiment 5 2D electrophoresis analysis
E N D
Presentation Transcript
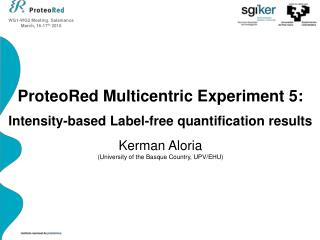
Salamanca, 16-17 March, 2010 ProteoRed Multicentric Experiment 5 2D electrophoresis analysis
Samplesto be analyzed. Centersinvolved A mixture of around 150 E. Coli proteins (identical in each sample). This mixture has been prepared by fractionation of the cytoplasmatic proteome of E.Coli. It contains soluble proteins, of a wide range of pI and Mw. Four spiked mammalian proteins: CYC_HORSE (Cytochrome C, Mw 12362), added at the ~ 1 pmol/ 1 mg total protein level. MYG_HORSE (Apomyoglobin, Mw 16952), at ~ 200 fmol / 1 mg total protein ALDOA_RABIT (Aldolase, Mw 39212), at ~ 25 fmol / 1 mg total protein ALBU_BOVIN (Serum albumin, Mw 66430), at ~ 1 fmol / 1 mg total protein These four proteins have been spiked in different amounts in samples A and B, with ratios ranging from 1.5:1 to 5:1 between the two samples. Results available from HUVH, CIB, IIB-UAB and CIMA.
Experimental procedure • Data (MIAPE) are available from HUVH and CIMA. • Sample preparation and application: • Sample buffer: 7M urea, 2M thiourea, 4% CHAPS, 120/40 mM DTT; ampholites pH range 3-10 (1%) or 3-11 (2%); 1,2% destreak used in HUVH • First dimension: • Sample loading: cup loading, 150 mg HUVH and 9 mg CIMA. • IPG strips pH range 3-10 or 3-11 NL. • Second dimension: • 12,5% acrylamide gels (30%/0.8% or 40%/2.6% acrylamide/bis-acrylamide) • Inter dimension treatment: No differences. • Image capture: • Typhoon 9400 or trio with similar settings. • Image analysis: • Same Spots v 3.3 or Decyder v 6.5. Automated mode.
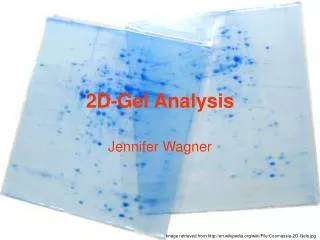
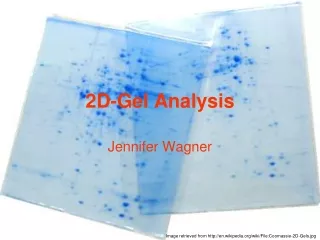
Gel images. Group 1 Gel N.72052 Gel N. 72051 Gel N. 72053
Representative gel images Group 2 Group 1 Group 3 Group 4
T-test 2.10E-05 Ratio -1.73 493 T-test 7.70E-06 Ratio -1.73 492
858 T-test 1.40e-06 Ratio -2.82 857 T-test 3.30e-06 Ratio -2.93
500 T-test 5.20E-05 Ratio -1.8 T-test 0.00062 Ratio -1.79 372
489 T-test 9.80E-06 Ratio -1.77 495 T-test 1.60E-05 Ratio -1.77
362 T-test 0.00014 Ratio -1.69 926 T-test 0.0089 Ratio -1.73
Cuantificacion Cleanup Proteored muestras para Dige ug/ul BSA A 570