Attenuation Models for High-F Simulations
This paper by Thomas H. Jordan and Xin Song discusses advanced attenuation models for high-frequency seismic simulations as utilized in the SCEC CyberShake project. It emphasizes the strong frequency dependence of QS and its non-linear relationship with Vs at varying depths. The study compares the Hauksson & Shearer velocity model with CVM-S and CVM-H, revealing that the former exhibits greater similarity to CVM-S. Key findings include depth-dependent QS-VS relationships and attenuation characteristics essential for accurate seismic hazard assessments.

Attenuation Models for High-F Simulations
E N D
Presentation Transcript
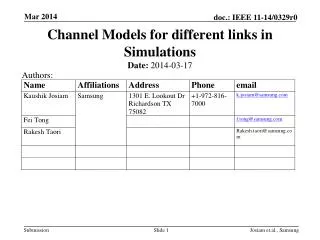
Attenuation Models for High-F Simulations Thomas H. Jordan and Xin Song May 2nd, 2013 Song & Jordan
Q Models Used in SCEC Simulations Song & Jordan
z = 1 km z = 1 km z = 1 km z = 1 km Hauksson & Shearer (2006) velocity model (bottom-left) is more similar to CVM-S (top-right) than CVM-H (top-left) Song & Jordan
z = 10 km z = 10 km z = 10 km Hauksson & Shearer (2006) velocity model (bottom-left) is more similar to CVM-S (top-right) than CVM-H (top-left) Song & Jordan
Qs is NOT linearly related to Vs at 1km depth z = 1 km Song & Jordan
Qs is NOT linearly related to Vs at 10km depth Song & Jordan
Qs ≈ Qpat 1km depth Qp Qs Song & Jordan
Qs > Qpat 10km depth Qp Qs Song & Jordan
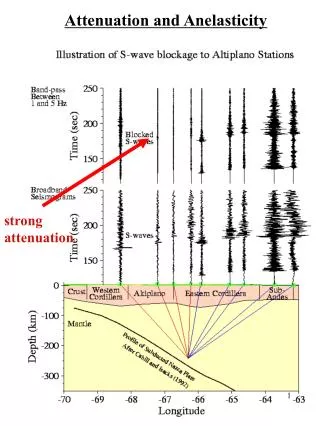
ShakeMap Database QS ~ f1 QS ~ f1/2 QS ~ f0 Attenuation shows strong frequency dependence: QS~ fγwhere γ > 0.5 Song & Jordan
ShakeMap Database QS ~ f1 QS ~ f1/2 QS ~ f0 Attenuation shows strong frequency dependence: QS~ fγwhere γ > 0.5 Song & Jordan
ShakeMap Database QS ~ f1 QS ~ f1/2 QS ~ f0 Attenuation shows strong frequency dependence: QS~ fγwhere γ > 0.5 Song & Jordan
H & S shows lower average VSand VP at shallow depths than either CVM-S or CVM-H. Song & Jordan
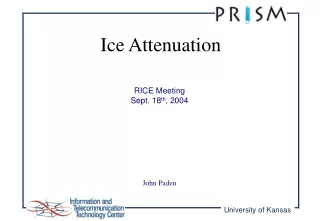
When corrected to low frequencies using QS ~ f2/3, H & S is in close agreement with QS = 50 VSat depth, but not near the surface (z < 5 km). Song & Jordan
QS = 50 VS Horizontal averages over CyberShake region Song & Jordan
Conclusions • Hauksson & Shearer (2006) velocity modelis more similar to CVM-S than CVM-H over CyberShake region. • Qs is NOT linearly related to Vs • Qs≥ Qp • H & S shows lower average VS and VP at shallow depths than either CVM-S or CVM-H. • Attenuation shows strong frequency dependence: QS ~ fγwhere γ > 0.5. • When corrected to low frequencies using QS ~ f2/3, H & S is in close agreement with QS = 50 VS at depth, but not near the surface (z < 5 km). Song & Jordan
Recommended Q Model • Use depth-dependent QS-VSrelationships given in following tables • Use QS ~ fγwhere γ = 0.7. • Use Qp = 1.9 Qs0.9. Song & Jordan
A(z) from H&S CyberShake Averages (assumes f0 = 4 Hz) Song & Jordan
A(z) from H&S CyberShake Averages (corrected to f = 0.5 Hz assuming QS ~ f0.7) Song & Jordan