Download
1 / 1
10 likes | 175 Vues
EVALUATION OF SURFACE SOLAR IRRADIANCE IN COUPLED CLIMATE MODELS. Anastasia Romanou and Beate Liepert. Dept. Applied Physics and Math, Columbia University, New York. Lamont-Doherty Earth Observatory of Columbia University, Palisades New York. Introduction. Summary.

E N D
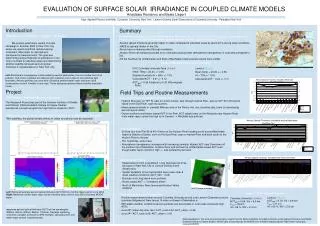
EVALUATION OF SURFACE SOLAR IRRADIANCE IN COUPLED CLIMATE MODELS Anastasia Romanou and Beate Liepert Dept. Applied Physics and Math, Columbia University, New York. Lamont-Doherty Earth Observatory of Columbia University, Palisades New York Introduction Summary Atmospheric Transparency ~ Visibility ~ Air Quality Atmospheric transparency measurements from New York City to rural Lamont-Doherty Earth Observatory (15 miles north of Manhattan) show distinct spatial patterns between June 16th and July 22nd. • Aerosol optical thickness generally higher in urban compared to suburban areas by about 20 % during clean conditions. • HAZE is optically thicker in the City. • Rivers have a cleaning effect through ventilation. • Hudson River can transport polluted air to rural area causing lower atmospheric transparency in rural area compared to City. • Off the Southern tip of Manhattan and East of Manhattan urban pollution plume more visible. We present preliminary results of a field campaign in Summer 2003 in New York City, where we used a handhold remote sensing instrument (Microtops) for atmospheric transparency measurements. The goal was determining optical thickness of polluted air in the City in contrast to suburban areas and determining whether satellite retrieved aerosol optical thickness is representative for New York City. General Weather from 6.16 to 7.22.2003: NYC Columbia University Area (Urban): Mean Temp = 24.2C +/- 2.8C Relative Humidity rH = 68% +/- 13% Calculated AOT ~ 0.31 +/- 0.12 AOT500 = 0.36 (Hudson) to 0.42 (Morningside Park) Lamont (Rural): Mean Temp = 23.0C +/- 2.5C rH = 70% +/- 12% Calculated AOT ~ 0.24 +/- 0.11 Left: Atmospheric transparency is attenuated by aerosol particulates, the most visible form of air pollution. Sub-micron particles are effective light scatterers and in case of soot effective light absorbers. Aerosol particles can grow with increasing ambient water vapor and form cloud condensation nuclei if humidity is very high. These activated particles reduce visibility drastically (haze). Project Field Trips and Routine Measurements The Research Team and Educational Outreach East - West Profile across Midtown Manhattan: Hudson River pier on 72nd St, east to Lincoln Center, east through Central Park, east on 60th St to Roosevelt Island in the East River, east into Queens. • Measurements directly in crowded Midtown and on the Rivers. Hot, dry, cloudfree day, some Cu developing, aerosol layers visible. • Dryest contitions and hence lowest AOT in the Park. AOT clearly lower on the Westside near Hudson River (note water vapor content as high as in Queens) -> Westside less polluted. The Research Project was part of the Summer Institute of Climate and Planets, NASA Goddard Institute for Space Studies' educational outreach program for High School students in NYC. Satellites are able to detect lifted plumes of polluted air emitted from urban areas. With satellites, the global climatic effects of urban air pollution can be assessed. Circle Line Route: 3h Boat tour from Pier 83 at 42nd Street on the Hudson River heading south around Manhattan Island to Statute of Liberty, north on the East River, east on Harlem River and back south on the Hudson River to the pier. • Hot, humid day, some haze. • Atmospheric transparency increases with increasing humidity. Highest AOT near Downtown off the southern tip of Manhattan. Hudson River and northern tip of Manhattan lowest AOT even though water vapor content is high -> less polluted by aerosols. New York City Profile: Measurements from Long Beach, Long Island across three boroughs of New York City to Lamont-Doherty Earth Observatory. • Spatial Variability of the metropolitan area under clear & clean weather conditions (AOT_500 ~ 0.20) • Brooklyn and Long Island more polluted. • Rivers lowest AOT -> "ventilation effect". • North of Manhattan, New Jersey and Hudson Valley cleanest. Jamaica Bay East River Hudson MODIS image of the day Left:Retrieved average aerosol optical thickness AOT (500nm) monthly mean and for June 2003. Right:Retrieved column water vapor content monthly mean and for July 2003 (Courtesy MODIS team). June 27th 2003: Hot and hazy day: Urban versus Suburban Comparison:Routine measurements taken around Columbia University and at rural Lamont Observatory and in suburban Ridgewood, New Jersey,15 miles northwest of Manhattan in . • With stable weather conditions aerosol particles can accumulate in rural areas and cause high AOTs. • June 23th (clean day after rain): AOT_rural=0.34, AOT_urban = 0.42; • June 24th: AOT_rural=0.46, AOT_urban = 0.42 Columbia University: (Urban) AOT500 = 0.96, Vis = 9.0 km Tmax = 32.8 C rH = 59 %, WV = 2.4 cm Lamont:(Rural) AOT500 = 0.79, Vis = 9.9 km Tmax = 31.0 C rH = 63 %, WV = 2.6 cm Microtops sunphotometer measures aerosol optical thickness (AOT) at five wavelengths (380nm, 500nm, 675nm, 936nm, 1020nm). Rayleigh scattering correction; portable, computer & GPS interface, calculates AOT and water vapor content instantaneously. Acknowledgments: This work was sponsored by a grant from the National Science Foundation Division of Atmospheric Sciences and NASA Goddard Institute for Space Studies. MODIS data are provided by the MODIS team at NASA Goddard Space Flight Center (www.gsfc nasa.gov/MODIS)