Download
1 / 38
380 likes | 508 Vues
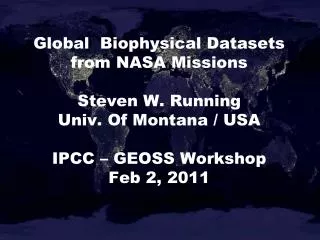
Global Biophysical Datasets from NASA Missions Steven W. Running Univ. Of Montana / USA IPCC – GEOSS Workshop Feb 2, 2011. CEOS ECV (Essential Climate Variables) from GCOS – 138, Aug 2010. Albedo Landcover FAPAR LAI Biomass (is NPP better?) Soil Carbon (from satellite?) Fire Disturbance

E N D
Global Biophysical Datasetsfrom NASA MissionsSteven W. RunningUniv. Of Montana / USAIPCC – GEOSS WorkshopFeb 2, 2011
CEOS ECV (Essential Climate Variables)from GCOS – 138, Aug 2010 • Albedo • Landcover • FAPAR • LAI • Biomass (is NPP better?) • Soil Carbon (from satellite?) • Fire Disturbance • Soil Moisture
LANDCOVER INTERCOMPARISON Thematic standards Reference database (GLC2000) Comparative validation & assessment Probability
MODIS Annual Disturbance Index Mildrexler et al 2009
Global Net Primary Production trend (2000-2009) Zhao & Running 2010, Science
Global Trend in NPP (1982 – 2009) AVHRR + MODIS with EOS algorithm
Consistency between MODIS NDVI and NPP (1982-2009) Zhao and Running 2010
Non-Frozen Season Trend (1979-2008) (SSM/I) Days yr-1 Mean Northern Hemisphere trend
Multi-Year Trend in Estimated Mean Annual ET and P-ET (1983-2006) • ~73% of the global domain shows a positive ET trend; • BUT • ~51% of the domain shows a negative water balance (P-ET) trend. ET P-ET
AERONET Aerosol Robotic Network • Aerosol Optical Properties Research & Enabling Project • Program of long term systematic network measurements • Mission Objectives • Validation of Satellite Aerosol Retrievals • Characterization of aerosol optical properties • Synergism with Satellite obs., Climate Models • Expanding to in situ Ocean Color & possibly total column CO2
GLORY 2/2011 Aerosols, TSI OCO-2 2/2013 Global CO2 AQUARIUS 6/2011 w/CONAE; SSS SMAP 11/2014 w/CSA Soil Moist., Frz/Thaw LDCM 12/2012 w/USGS; TIRS GPM 7/2013, 11/2014 w/ JAXA; Precip ICESat-II 10/2015 Ice Dynamics Missions in Formulation and Implementation – 12/2010 NPP 10/2011 w/NOAA, DoD EOS cont., Op Met.
Unsustainable groundwater withdrawalDepletion rate 4cm/yr Groundwater withdrawals as % of recharge, 2002-2008. Rodell et al Nature 2009
Mean Thaw Date (SSM/I, 1988-2001) Julian Day SMAP Science Objectives Soil moisture and freeze/thaw state are primary environmental controls on water mobility and associated constraints to evaporation and Net Primary Productivity Dry Spring Soil Moisture Wet Spring Soil Moisture Summer Air Temperature Anomaly [ºC] SMAP measurements of soil moisture and freeze-thaw cycles will provide an integrated measure of critical controls on surface water mobility and associated constraints to ecosystem processes.
OCO Measuring CO2 from Space Retrieve variations in the column averaged CO2 dry air mole fraction,XCO2over sunlit hemisphere OCO/AIRS/GOSAT FTS Tower Aircraft Flask • Collect NIR spectra of CO2 and O2 absorption in reflected sunlight • Validate measurements to ensure XCO2 accuracy of 1 - 2 ppm (0.3 - 0.5%) Initial Surf/Atm State Generate Synthetic Spectrum Instrument Model New State (inc. XCO2) Difference Spectra Inverse Model XCO2
DESDynI Radar and Lidar Capabilities for Biomass and Aboveground Carbon Storage Vegetation 3D Structure & Biomass: Radar and Lidar Vegetation Type Upland conifer Lowland conifer Northern hardwoods Aspen/lowland deciduous Grassland Agriculture Wetlands Open water Urban/barren L-band Radar – high resolution mapping of low forest biomass and disturbance, extend sensitivity with lidar Multi-beam Lidar – accurate biomass and canopy profiles (along-track) at 25 m resolution, extend spatially with radar Terrestrial Carbon Storage and Changes High: 30 kg/m2 Biomass Low: 0 kg/m2 22
NRC Decadal Survey HyspIRI Visible ShortWave InfraRed (VSWIR) Imaging Spectrometer+ Multispectral Thermal InfraRed (TIR) Scanner VSWIR: Plant Physiology and Function Types (PPFT) Multispectral TIR Scanner Map of dominant tree species, Bartlett Forest, NH Red tide algal bloom in Monterey Bay, CA
Linkages between International Programs concerned with Terrestrial Earth Observation
LPV Objective & Goals To foster and coordinate quantitative validationof higher level global land products derived from remotely sensed data, in a traceable way, and to relay results so they are relevant to users • To increase the quality and efficiency of global satellite product validation by developing and promoting international standards and protocolsfor: • Field sampling • Scaling techniques • Accuracy reporting • Data / information exchange • To provide feedback to international structures (GEOSS) for: • Requirements on product accuracy and quality assurance (QA4EO) • Terrestrial ECV measurement standards • Definitions for future missions
Focus Groups * ECV
KEY FINDINGS • Many global datasets now exist • Need validation and intercomparison amongst sensors • Need to unify formats, gridding, units • Coordinate data distribution • Continuity to new sensors
CO2 Emissions from Land Use Change 1990s Emissions: 1.5±0.7 PgC 2000-2005 Emissions: 1.3±0.7 PgC 2006-2010: Emissions: 0.9±0.7 PgC CO2 emissions (PgC y-1) CO2 emissions (PgCO2 y-1) Friedlingstein et al. 2010, Nature Geoscience; Data: RA Houghton, GFRA 2010
America Africa Asia Pan-tropics Fire Emissions from Deforestation Zones Global Fire Emissions Database (GFED) version 3.1 1400 1200 1000 Fire Emissions from deforestation zones(Tg C y-1) 800 600 400 200 0 01 99 1997 07 05 2003 2009 Year van der Werf et al. 2010, Atmospheric Chemistry and Physics Discussions
Modelled Natural CO2 Sinks 2 0 Land sink (PgCy-1) 5 models -2 -4 -6 1970 2010 1980 2000 1960 1990 2 0 Ocean sink (PgCy-1) 4 models -2 -4 -6 1970 2010 1980 2000 1960 1990 Time (y) Updated from Le Quéré et al. 2009, Nature Geoscience
Future Orbital Flight Missions – 2010 – 2022 (International contributions)
Gravity Recovery & Climate Experiment 500 km orbit 220 km separation Distance accuracy 0.001 mm
Focus Group Responsibilities • Engage community members (via listserv/website) • Update on progress, relevant meetings • Report back to LPV group on activities, meetings, new products, potential funding mechanisms • Organize at least 1 topical workshop within leadership term • Expand LPV activities, field sites, collaboration globally • Lead productinter-comparisonactivities • Lead the development and writing of “best practice” land product validation protocols • Define product error definitions for ECV’s, LTDR’s for the climate modeling community
Global Water Availability Risk Vorasmairty et al Nature 2010