Phylogenetic Trees
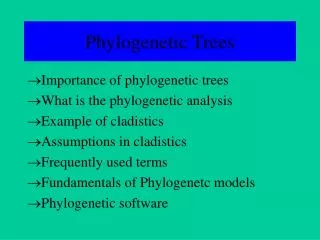
Phylogenetic Trees. Numerical taxonomy. Awash in Molecular Data. Zuckerkandl and Pauling (1965) Originated Molecular Clock Basic flavors of tree construction Distance Matrices ( eg Neighbor Joining) Parsimony Conserved Indels. Distance Matrices.
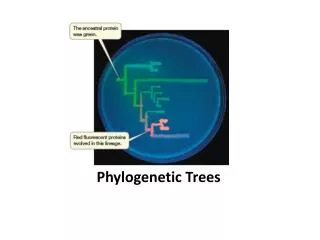

Phylogenetic Trees
E N D
Presentation Transcript
Awash in Molecular Data • Zuckerkandl and Pauling (1965) Originated Molecular Clock • Basic flavors of tree construction • Distance Matrices (eg Neighbor Joining) • Parsimony • Conserved Indels
Distance Matrices • If we compare the sequences of any two taxa now, the evolutionary distance between them is related to the number of sequence differences between them. Woeseand Fox use in their 1977 paper. • SA,B = x/(x+y+z) • where x = # characters A and B have in common • y = # characters positive for A, but not for B • z = # characters positive for B, but not for A • Current distance matrix methods use either nucleotide or amino acid residues from DNA or protein sequences, respectively. • UnweightedPair Group Method with Arithmetic Mean (UPGMA). Unweighted means all characters are equal in their importance. Pair group means you compare two sequences or groups of sequences at a time. • Finally, “with arithmetic mean” refers to the fact that if one sequence is being compared to a group of two sequences, the relationship is the mean of the relationships between the one sequence and each of the two sequences from the group.
Here is an example of UPGMA. • Sequences to be compared: • W = ATCGCCGATAGTAGCAA • X = ATCACCGACAGCAGTGA • Y = ATCACCGATAGCAGCAA • Z = GTCACTGGCGGCGAAGG • Step 1: Make a matrix showing the number of differences between all pairs: • X Y Z W • X - 3 8 5 • Y 3 - 10 2 • Z 8 10 - 12 • Step 2: Find pair of most related sequences: W & Y, only 2 differences • Step 3: Update the difference matrix showing W&Y as a group: • X Z • W&Y 4 11 • Z 8 • Step 4: Find next pair: W&Y & X, mean of 4 differences Repeat steps 2-4 until all sequences are used. Draw tree showing branches from most related out & branch lengths equal to ½ the differences between the groups:
Problems with distance matrices • While the key assumption that sequence changes accumulate over time is very well supported, there is plenty of evidence that building good trees is not as simple as grouping sequences according to overall similarity. The first problem is that overall similarity is comprised of some combination of the following: • a) shared ancestral characters – characters retained from a common ancestor • b) shared derived characters – characters shared due to recent changes through a common ancestor • c) homoplasies – characters shared due to convergence through different paths or reversals involving multiple changes
Problems with distance matrices, cont’d. • Shared ancestral characters are not truly informative – every sequence in the comparison has them. Shared derived characters are what we really want to analyze. Homoplasies often might look like shared derived characters, but they lack the crucial key to true phylogenetic trees – sister taxa have common sequences due to common descent. • The second problem is one we eluded to earlier - that there can be differences in the rate of evolutionary change (often called the molecular clock). For example, if you compare the alpha-globin sequences of baboon, rhesus monkey, and human, • baboon – rhesus 9 AA changes • baboon – human 11 “ • human – rhesus 5 “ • you would reach the conclusion that human and rhesus monkey are more closely related even though plenty of evidence clearly shows that the two monkeys are more closely related.
Parsimony (character-based) • The most parsimonious tree is the simplest one that explains the differences between sequences. • However, unlike distance matrix methods, parsimony methods only use “informative” sites = sites where there has been one change (e.g., two character states possible) and at least two sequences share the change. In this way, parsimony tries to avoid ancestral, homoplasic, and unique (change only seen in one sequence) characters. • The simplest tree is the one that invokes the fewest changes to account for all the sequences. In the Maximum Parsimony Method, no other assumptions are made
Parsimony, cont’d Note that while maximum parsimony supports the WY grouping, the few number of informative sites makes it impossible to separate X from Z. In fact, the tree we got from the distance matrix method is equally parsimonious (simple) as the far right tree above. By that I mean the two trees both explain the data and we cannot say which one is more likely.
Parsimony Problems • A common problem with maximum parsimony is that it cannot find the shortest tree because too many taxa are being compared and/or there are too few informative sites to use. • Another problem is that the shortest tree is not the correct tree due to homoplasies (lots of reversals, convergence). One way around this problem is to use more information if it is available. • The Maximum Likelihood Method adds in information on the relative probability of transition versus transversion mutations and how likely each position is to change. Not only is more upfront knowledge required, but more computing time is needed to deal with all the added data.
Conserved Indels • One of the major problems with both distance matrix and parsimony methods is that they rely on comparing single nucleotide or amino acid residues. • Finding that two sequences out of many share a G at a particular position is consistent with a shared derived character, but that is not the only explanation. Those two sequences could have each arrived at the change to G through different routes. • Maximum Likelihood tries to deal with this problem by adding in more information. An alternative approach is to focus on changes that are so big and abrupt that it is much less likely that two sequences arrived at the same point through 2 different routes. What kind of changes are we talking about? • Conserved insertions and deletions, or indels for short, usually examined at the amino acid sequence level. Consider the following example for the enzyme phosphoribosylformylglycinamidinesynthase from 6 organisms (dashes indicate identity to the top sequence shown; spaces indicate indel).