Download
1 / 44
440 likes | 755 Vues
Explore the role of phylogenetic trees in computational biology, from analyzing genetic data to studying evolutionary patterns. Understand how similarities across species offer insights into common ancestry and the evolution of life on Earth.

E N D
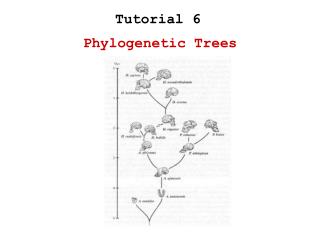
PHYLOGENETICTREES Introduction to Computational Biology CIS 786With Dr. Barry Cohen Tuesday, May 7, 2001 Paul Wood Yanchun Song Chaowei Sun
Introduction Paul Wood Chaowei Sun Yanchun Song
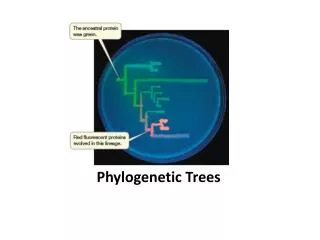
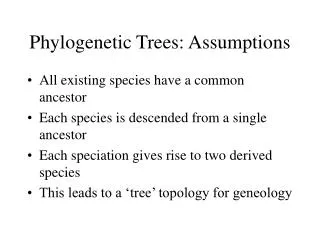
What is a Phylogenetic Tree? • Phylogenetic trees are representations of the similarity or dissimilarity—among both existing & extinct living individuals &—across a set of characteristics or features. • Similarity of molecular and physical systems provide compelling evidence that all life on earth arose from a common ancestry. Carl R. Woese, Interpreting the universal phylogenetic tree, Proc. Natl. Acad. Sci. USA, Vol. 97, Issue 15, 8392-8396, July 18, 2000 http://www.pnas.org/cgi/content/full/97/15/8392
Why do we study Phylogenetic Trees? …because humans need to….fill in blanks… …and understand in our own language… COMPARE • Shall Ithee to a summers day? • W. Shakespeare, Sonnet 18 • There is a between Homer and Hesiod, between Æschylus and Euripides… • P. Shelley, Prometheus Unbound • Life all around me…All in the loom, and oh What ! Woodlands, meadows,… • E. L. Masters, Spoon River Anthology • If the foolish call them “flowers”/Need the wiser tell? // If the savants “ ” them/It is just as well. • E. Dickenson, Part 1: Life, XCIV SIMILARITY PATTERNS CLASSIFY
What are some applications of “phylogenetic” trees? Computational Linguistics • Manning, Christopher D. and Heinrich Schutze, Foundations of Statistical Natural Language Processing, MIT Press, Cambridge Massachusetts, 1999. http://www.aclweb.org/archive/fsnlp-ch1.pdf Archaeological Statistics • Archaeological Statistics: Brief Bibliography http://ad.trafficmp.com/tmpad/banner/itrack.asp?rv=3.0&id=16&nojs=1 Broad Historical and Technical Overview • Discriminant Analysis and Clustering, Panel on Discriminant Analysis, Classification, and Clustering, Committee on Applied and Theoretical Statistics Board on Mathematical Sciences, Commission on Physical Sciences, Mathematics, and Resources National Research Council, NATIONAL ACADEMY PRESS, Washington, D.C. 1988 http://www.ulib.org/webRoot/Books/National_Academy_Press_Books/discrim_analysis/discr001.htm
Phylogenetic trees are used to study locations, migrations, lives, health & cultures of populations. Xenia Katrina Helena Tara Ursula Velda Jasmine http://www.oxfordancestors.com/daughters.html
Phylogenetic trees are used to study physical & genetic variability, evolution of species. http://www.oxfordancestors.com/daughters.html
Which areas of the genome provide mutant data to create phylogenetic trees? Autosomes Mitochondrial Control Region Y-Chromosome
How do we get data for computational biology? TISSUE STEP 1: Eukaryotic Biochemical Protocol is……kind of like washing greasy dishes! Homogenize + Detergent (Sodium Dodecyl Sulphate SDS) High Weight DNA + Concentration gradient Phenol DNA DNA Medium Weight Genetic Material Remove Upper Phase DNA DNA RNA SPIN 40 hrs @ 40,000 RPM RNA RNA Insoluble Protein RNA + RNA Low Weight Cesium Chloride Cs Cs Cs Phenol Cs
How do we get sequence data? STEP 2: Cut up DNA using one of “two” methods… &STEP 3: Label fragments using one of “two” methods… Gel Electro- phoresis 2 a: Sanger (Dideoxy) ~ 4 Reactions Restriction Enzymes Fluorescent Dye Fluorescence Spectroscopy DNA 3a: + DNA atcgagtcc DNA + DNA DNA EtOH RNA 3b: 32Phosphate Auto Radiography RNA RNA RNA 2 b: Maxam-Gilbert RNA Gel Electro- phoresis ~ 4 Reactions Cs Cs Cs Cs
What is the rate of evolutionary change…or…how many mutants can we expect? • Estimates vary depending upon assessment method and location within the genome • “…134 independent mtDNA lineages spanning 327 generations found ~2.5 mutations per site per 1000 yrs.” • A high observed substitution rate in the human mitochondrial DNA control region. Parsons TJ, Muniec DS, Sullivan K, Woodyatt N, Alliston-Greiner R, Wilson MR, Berry DL, Holland KA, Weedn VW, Gill P, Holland MM. Nat Genet 1997 Apr; 15(4):363-8. Armed Forces DNA Identification Laboratory, Armed Forces Institute of Pathology, Rockville, Maryland 20850, USA. http://www.mhrc.net/mitochondria.htm • M. O. Dayhoff, R. M. Schwartz, and B. C. Orcutt. (1978) A model of evolutionary change in proteins. In: Atlas of Protein Sequence and Structure, M. O. Dayhoff, (Ed.). National Biomedical Research Foundation, Vol. 5, Suppl. 3, chapter 22, 345-352)
A B C D E B 2 C 4 4 D 6 6 6 E 6 6 6 4 F 8 8 8 8 8 What do sequence data and input files typically look like? PHYLIP INPUT FILE (SEQUENCE) • 282 1 AY053096 cacgggagct …variable region... 282 2 AY053097 cacgggagct …variable region... 282 3 AY053098 cacgggagct …variable region... 282 . 263 !Domain=Data property=Coding CodonStart=1; #W._Pygmy_(1)_{African} TTC TTT CAT GGG #W._Pygmy_(6)_{African} ... ... ... ... #Kung_(7)_{African} ... .C. ... ... .T. #Kung_(9)_{African} ... ... ... ... ... #Kung_(10)_{African} ... ... ... ... ... #Kung_(13)_{African} ... ... .G. ... ... DISTANCE MATRIX MEGA INPUT FILE (SEQUENCE)
What are some of the major classifications of algorithms & software applications? PHYLIP, PAUP & MEGA are represented across most categories. PHYLIP is the most widely distributed and used. PAUP is most frequently cited in publications. MEGA has a nice GUI and is user friendly. http://evolution.genetics.washington.edu/phylip/software.html
Two Types of Data • Distance-based: • The input is a matrix of distances between the species (e.g., the alignment score between them or the fraction of residues they agree on). • Character-based: • Examine each character (e.g., a base in a specific position in the DNA) separately
Pairwise Distance • Model of Jukes and Cantor • Each base in the DNA sequence has an equal chance of mutating, and when it does, it is replaced by some other nucleotide uniformly. • Distance dij: • The fraction f of sites u where residues xui and xujdiffer (presupposing an alignment of the two sequences). T. H. Jukes and C. Cantor, Mammalian Protein Metabolism, Chapter Evolution of protein molecules, pages 21-132, Academic Press, New York, 1969
How to Make a Tree? • Clustering methods: • UPGMA • Neighbor-joining • Parsimony:
Clustering Method: UPGMA • UPGMA: Unweighted Pair Group Method with Arithmetic Mean • Di,jbetween two clusters of species Ci andCj: d(p, q) – distance function between species, ni = |Ci| and nj = |Cj|. http://www.math.tau.ac.il/~rshamir/algmb/00/scribe00/html/lec08/node21.html
Algorithm • Initialization: • Initialize n clusters with the given species, one species per cluster. • Size of each cluster: ni ← 1; assign a leaf for each species. • Iteration: • Find minimal Dij, • Create a new cluster (ij), which has n(ij) = ni + nj members. • Connect i and j to the new node (ij), each given length Di,j /2. • Compute the distance from (ij) to all other clusters as a weighted average of the distances from its components: • Replace the columns and rows of clusters i and in D with cluster (ij), with D(ij),k computed as above. • Termination: • until there is only one cluster left.
A B C D E B 2 C 4 4 D 6 6 6 E 6 6 6 4 F 8 8 8 8 8 UPGMA Example http://www.icp.ucl.ac.be/~opperd/private/upgma.html
A,B A B C C D E D E B 2 C 4 C 4 4 D 6 6 D 6 6 6 E 6 6 4 E 6 6 6 4 F 8 8 8 8 F 8 8 8 8 8 UPGMA Example (cont’d) D(A,B),C = (DAC + DBC) / 2 = 4 D(A,B),D = (DAD + DBD) / 2 = 6 D(A,B),E = (DAE + DBE) / 2 = 6 D(A,B),F = (DAF + DBF) / 2 = 8 http://www.icp.ucl.ac.be/~opperd/private/upgma.html
A,B AB,C ABC,DE C D,E D,E F D,E 6 8 C 4 D,E F 6 8 6 8 F 8 8 8 UPGMA Example (cont’d) http://www.icp.ucl.ac.be/~opperd/private/upgma.html
Additivity • Given a tree, its edge lengths are said to be additive if the distance between any pair of leaves is the sum of the lengths of the edges on the path connecting them.
m k i j Additivity Dim = Dik + Dkm Djm = Djk + Dkm Dij = Dik + Djk
i m 0.1 0.1 0.1 k l 0.4 0.4 j n The idea of Neighbor-joining • Distance of i from the rest of the tree: • To find neighboring nodes i and j: min(Di,j – (ui + uj) ) R. Durbin, et al, Additivity and neighbour-joining, Biological Sequence Analysis, p. 169-173, Cambridge Univ. Press, 1999.
Algorithm: Neighbor-Joining • Initialization: • Define T to be the set of leaf nodes, one for each given sequence, and put n = T. • Iteration: • For each species, compute . • Choose a pair i, j in T for which Di,j – (ui + uj) is minimal. • Join i and j to a new cluster k=(ij). Calculate the branch lengths from i and j to the new node k as: Di,k=1/2(Di,j+ ui – uj), Dj,k=1/2(Di,j+ uj – ui) • Compute the distances between k and each other cluster: Dk,m=1/2(Di,m+ Dj,m – Di,j), mT • Remove i and j from T and add k. • Termination: • When T consists of only two nodes i and j, connect the remaining nodes by a branch of length Dij.
MEGA 2 • Molecular Evolutionary Genetics Analysis • Provides tools for exploring and analyzing DNA and protein sequences from evolutionary perspectives
History of MEGA • MEGA 1 DOS-Based • MEGA 2 User-friendly interface Windows Macintosh Sun Workstation Linux
Input • Character Sequence - DNA/RNA - Protein • Distance Matrix • Import data from other formats, PHYLIP, XML, etc.
Methods and Algorithms • methods for constructing phylogenetic trees from molecular data. 1. UPGMA Method 2. Neighbor-Joining (NJ) Method 3. Minimum Evolution (ME) Method 4. Maximum Parsimony (MP) Method
Unweighted Pair Group Method with Arithmetic Mean - UPGMA • Assumes a constant rate of evolution • sequential clustering method • Produces a rooted tree • edge lengths - time measured by a molecular clock
Neighbor-Joining - NJ • No assumption • finds neighbors sequentially that may minimize the total length of the tree • produces an unrooted tree • root - midpoint of the longest route connecting two taxa in the tree
Minimum Evolution - ME • Finds a topology with the smallest sum of branch lengths • time-consuming: sum of branches for all topologies have to be evaluated
Maximum Parsimony - MP • Finds a topology that requires the smallest number of changes(substitution) • For each topology – sums up total number of substitutions
Branch length are equal - constant rate Output - UPGMA
Root Unrooted Tree - NJ
Branch length is proportional to distance Output - NJ
Comparison Computational Method Optimality criterion Clustering algorithm Parsimony Characters Minimum Evolution UPGMA Neighbor-Joining Distance
Comparison – Cont’d • UPGMA, Neighbor-Joining • Minimum Evolution, Maximum Parsimony • Fast O(n2), Large dataset • depends upon the order in which we add sequences to the tree • Time consuming, NP-Complete • use an explicit function relating the trees to the data
The End Thank you and enjoy the finals…