siRNA Treatments Suppress PLC Isoform Expression in MIN-6 Cells
Specific siRNA treatments reduce mRNA and protein expression of PLC isoforms in MIN-6 cells. Data analysis shows significant suppression compared to control.

siRNA Treatments Suppress PLC Isoform Expression in MIN-6 Cells
E N D
Presentation Transcript
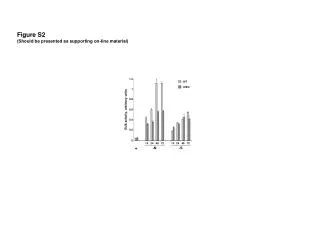
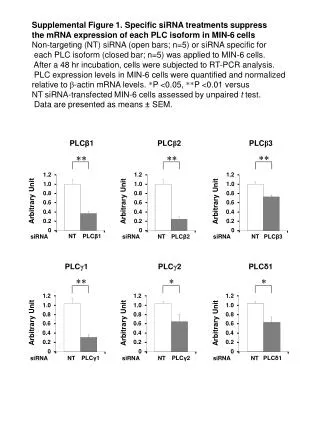
1.2 1.2 1.2 1.2 1.2 1.2 1.0 1.0 1.0 1.0 1.0 1.0 0.8 0.8 0.8 0.8 0.8 0.8 0.6 0.6 0.6 0.6 0.6 0.6 0.4 0.4 0.4 0.4 0.4 0.4 0.2 0.2 0.2 0.2 0.2 0.2 0 0 0 0 0 0 Supplemental Figure 1. Specific siRNA treatments suppress the mRNA expression of each PLC isoform in MIN-6 cells Non-targeting (NT) siRNA (open bars; n=5) or siRNA specific for each PLC isoform (closed bar; n=5) was applied to MIN-6 cells. After a 48 hr incubation, cells were subjected to RT-PCR analysis. PLC expression levels in MIN-6 cells were quantified and normalized relative to β-actin mRNA levels. *P <0.05, **P <0.01 versus NT siRNA-transfected MIN-6 cells assessed by unpaired t test. Data are presented as means ± SEM. PLCβ1 PLCβ2 PLCβ3 ** ** ** Arbitrary Unit Arbitrary Unit Arbitrary Unit NT PLCβ1 siRNA siRNA NT PLCβ2 siRNA NT PLCβ3 PLCγ1 PLCγ2 PLCδ1 ** * * Arbitrary Unit Arbitrary Unit Arbitrary Unit PLCγ1 PLCγ2 PLCδ1 siRNA NT siRNA NT siRNA NT
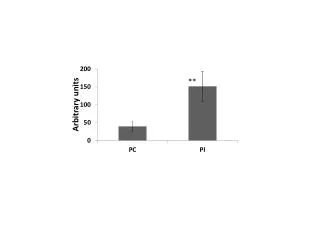
siRNA NT PLC-β1 NT PLC-γ1 siRNA Supplemental Figure 2. Specific siRNA treatments suppress the protein levels of PLC-β1 and PLC-γ1 isoforms in MIN-6 cells Non-targeting (NT) siRNA or siRNA specific for each PLC-β1 and PLC-γ1 isoforms were applied to MIN-6 cells. After a 48 hr incubation, immunoblot analysis was performed with MIN-6 cells lysate, using a monoclonal anti- PLCβ1 antibody (sc-5291, Santa Cruz) or a polyclonal anti- PLCγ1 antibody (#2822, Cell Signaling).
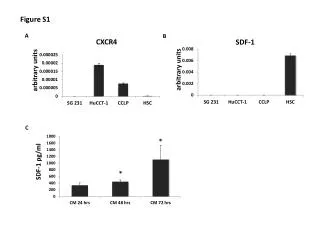
forward (5’ to 3’) reverse (5’ to 3’) β-actin TTGTAACCAACTGGGACGATATGG GATCTTGATCTTCATGGTGCTAGG CCATTCTCGGCCTTGACT GAPDH TGAAGGTCGGTGTGAACG PEPCK TTGCCTCCATGAAGTTTGAT GGCATTTGGATTTGTCTTCACT G6Pase AAAGAGACTGTGGGCATCAAATC AATGCCTGACAAGACTCCAGCC IL-6R CCAACCTTGTGGTATCAGCC TGGATGACGCATTGGTACTG PLC-β1 AAGCCAGATGGAAGAGGAGA GCGGATCTCATTGTGTTTCT PLC-β2 TCCTTCGAGTTCTCTGCACA TCTGGGGCATGTAGTTGGAA PLC-β3 TCCTTTGAGAACCATGTCG ATTCTTCACCAGGATACGGC PLC-γ1 GACTTCTCGGGACTTTGACC GTTAAGCCCTTGATCCACAT PLC-γ2 CGGAGGACAGTACAGATGAT TAGAGGATGGTGAAGCAACA PLC-δ1 GATTCACTCCTGCTTGCGA TCAATCTCCTCATCCTCCAG Supplemental Table 1. The oligonucleotide primers used for RT-PCR.
4A 5A 4B 4F 5B5C 5D 6A 6B Supplemental Table 2. Effects of several pretreatments on insulin content of MIN-6 cells and isolated islets Insulin contents of MIN-6 cells (1-5×10⁶ cells/well) and isolated islets (10 islets/well) used in the experiments are indicated. Left column shows the Figure numbers corresponding to each pretreatments. Data are presented as means ± SEM. Insulin content (ng) Fig. Pretreatments


![Concentration [arbitrary]](https://cdn2.slideserve.com/4860652/slide1-dt.jpg)