Understanding Topographic Maps for Natural Resource Engineering
90 likes | 186 Vues
Learn how to read topographic maps and understand watersheds for effective natural resource engineering projects. Explore key features, symbols, and contours on topographic maps to analyze terrain and landscapes.

Understanding Topographic Maps for Natural Resource Engineering
E N D
Presentation Transcript
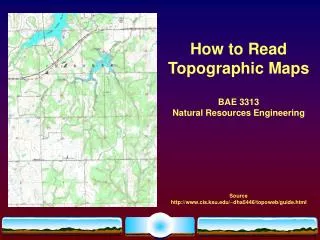
How to Read Topographic Maps BAE 3313 Natural Resources Engineering Source http://www.cis.ksu.edu/~dha5446/topoweb/guide.html
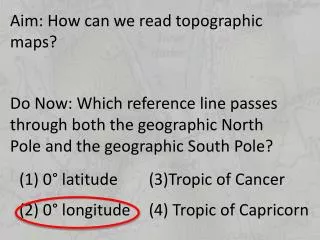
How is a Watershed? The total land area that contributes water to a stream, river or lake. Source: http://www.epa.gov/owow/watershed/whatis.html
What is a Topographic Map? • Shows elevation data for a small piece of the earth • Shows physical and manmade features • U.S. Geological Survey (USGS) is the primary distributor of topographic maps • 7.5 minute maps, 1:24,000 scale • Complete US coverage also available for 1:100,000 and 1:250,000 • Amount of detail shown on a map is proportional to the map scale • 1:24,000 - high detail • 1:100,000 - moderate detail • 1:250,000 - low detail
1:24,000 Topographic Map • Covers 7.5 minutes of latitude by 7.5 minutes of longitude • Approximately equal to 8 miles north-south and 6 miles east-west • One map called a quadrangle or “quad” • 28 inches long by 21 inches wide • Purchase from USGS or most outdoor stores
Cultural and Physical Symbols Forest: Shown in green Unforested: White; May be grass, soil, or some other surface Roads: Two parallel lines; Unbroken lines indicate paved roads, broken lines unpaved Trails: Dashed lines Streams and Rivers: Thin lines for streams, large blue area for larger rivers Lake: Solid blue area Marshy Area: Blue symbols enclosed by blue dashed line Buildings: Building shapes shown, may be filled or unfilled UTM Grid Lines: Especially useful for GPS, each grid square is 1 km x 1 km
Contours • Contour lines are continuous brown lines. Each line represents a specific elevation, and all locations along that line have the exact same elevation. • "Contour Interval 20 Feet" means that the elevation change between contour lines is 20 feet. • Contour lines close together have a large amount of elevation change. • Darker contour lines are Index and labeled contour. • An ‘X’ marks a spot elevation.
Contours - Slopes • How can you tell which side of the hill slope is highest? • Look at the contour lines ‘A’ and ‘B’ • ‘A’ is at elevation 7500 ft; ‘B’ is at elevation 7600 ft. • Traveling along line ‘C’ would be uphill; 100 ft elevation change. • Slope = Rise/Run
Contours - Direction of Flow • Water travels down gradient. • When contour lines identify a stream, they form a ‘V’ shape. • The ‘V’ always points upstream.
Contours – Hill Tops • Contour circle at ‘H’ shows that the land inside the circle is higher than the surrounding area. • ‘F’ and ‘K’ are also high points. • Exception: At ‘I’ there are tiny tick marks that point to the inside of the circular shape. This is a depression with no outlet.