Download
1 / 1
10 likes | 152 Vues
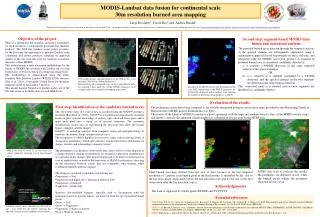
MODIS- Landsat data fusion for continental scale 30m resolution burned area mapping. Luigi Boschetti 1 , David Roy 2 and Andrea Baraldi 1

E N D
MODIS-Landsat data fusion for continental scale 30m resolution burned area mapping • Luigi Boschetti1, David Roy2and Andrea Baraldi1 • 1Department of Geographic Sciences, University of Maryland at College Park (USA) 2 Geographic Information Science Center of Excellence,, South Dakota State University, Brookings SD (USA) email: luigi.boschetti@hermes.geog.umd.edu; david.roy@sdstate.edu; andrea.baraldi@hermes.geog.umd.edu; Objective of the project There is a demand by the scientific and policy community for high resolution, systematically generated fire thematic products. The 2008 free Landsat access policy provides, for the first time, the opportunity to generate Landsat scale continental and global products, adopting an approach similar to the one typically used for moderate resolution missions such as MODIS. This study presents a fully automated methodology for the fusion of MODIS fire products with Landsat data to map burned area at 30 m resolution on a temporal rolling basis. The methodology is demonstrated using the freely available Web Enabled Landsat (WELD) ETM+ mosaics (Roy et al. 2010), covering the United States for the entire temporal extent of the Landsat 7 mission. This annual Landsat burned area product makes use of the full time series of available data for each WELD tile. Second step: segment-based MODIS data fusion and contextual analysis The potential burned areas detected through the temporal analysis of the spectral changes are subsequently segmented, using a segmentation approach based on proximity in space and time, and integrated with the MODIS active fire product. A segment of potential burned area is considered confidently detected if: a) it contains a MODIS detection in the same temporal interval of the spectral changes OR it is adjacent to a segment confirmed by a MODIS detection, and the spectral changes in the two segments are detected in the same temporal interval. The contextual analysis is iterated until no new segments are identified as confidently burned. 2008 yearly mosaic, showing location of the WELD tiles, each covering 150x150 km (5000x5000 pixels). Each Landsat path is acquired every 16 days, and adjacent paths are acquired 7 days apart: the weekly WELD composites used as input (right) never contain overlapping acquisitions. Location of the MOD14 active fire detections for the year 2002, reprojected in the WELD geometry for tile h02v05, displayed with a rainbow scale showing the number of detections (from purple=1 to red=9) Evaluation of the results The preliminary results have been compared to the visually interpreted polygons and severity maps provided by the Monitoring Trends in Burnt Severity (MTBS) project (Eidenshenk et al, 2007). The results of the Landsat-MODIS fusion have a good agreement with the high and medium severity class of the MTBS severity maps, and identify correctly the unburned islands mapped as ‘unburned to low severity’ in the MTBS data. SIAM™ preliminary classification. Legend: • First step: identification of the candidate burned areas • The whole time series of 1 year of data is classified using the SIAM™ automatic classifier (Baraldi et al., 2010). SIAM™ is a model-based decision-tree classifier based on prior spectral knowledge of surface types observed from space and it maps each pixel into a finite set of spectral categories. The automatic classification system aims at reproducing the processes that allow the human brain to interpret satellite images. • SIAM™ is rooted in concepts from computer vision and neurophysiology. It simulates the human image interpretation process: • The recognition of objects happens in successive stages with increasing levels of abstraction: preliminary sketch (pre-attentive vision) followed by elaboration on shapes, textures and relationships (attentive vision) • The preliminary classification of the whole time series, allows for the adoption of a change detection strategy based directly on semantics, rather than on reflectance or vegetation index changes. The proposed approach is an expert system based on a set of explicit rules, to analyse the time series of SIAM classifications, detecting all the transitions between classes that are compatible with burning, while avoiding potentially spurious changes. • The changes considered compatible with burning are: • Vegetation -> Soil • Vegetation with high LAI -> Vegetation with low LAI • Vegetation -> Charcoal • Light Soil -> Dark Soil • Spurious, fire-unrelated changes, typically hard to discriminate with the techniques based on spectral indices, are removed from the set of potential burned pixels: • Snow -> Soil • Snow -> Vegetation • Vegetation -> Water or shadow • Soil -> Water or shadow High LAI vegetation Medium LAI vegetation Other vegetation types Bare soil or built-up Water, snow Clouds, smoke plumes, shadow Unclassified WELD tile h02v05, week 35 of year 2002, true colour composite, showing several large burned areas. MTBS severity: unburnt to low low medium high um and high, and part of the low serverity MTBS areas MTBS data used to evaluate the results: the perimeters are displayed in red, while the burned pixels within the perimeter show the severity level. Final burned area map derived from one year of data: because of the low temporal resolution of Landsat, each burned pixel in the final product is identified by the day of the last non-cloudy observation before the fire detection (left) and by the day of the first observation after the fire detection (right). Acknowledgements The work is supported by NASA grants XXXXX and YYYYYYY. SIAM™ preliminary classification. Legend: High LAI vegetation Medium LAI vegetation Other vegetation types Bare soil or built-up Water, snow Clouds, smoke plumes, shadow Unclassified • Essential references • WELD: Roy, D.P., Ju, J.C., Kline, K., Scaramuzza, P.L., Kovalskyy, V., Hansen, M., Loveland, T.R., Vermote, E., & Zhang, C.S. 2010. Web-enabled Landsat Data (WELD): Landsat ETM plus composited mosaics of the conterminous United States. Remote Sensing of Environment, 114, 35-49, DOI 10.1016/j.rse.2009.08.011 • SIAM™ : A. Baraldi, L. Durieux, et al., “Automatic spectral rule-based preliminary classification of radiometrically calibrated SPOT-4/-5/IRS, AVHRR/MSG, AATSR, IKONOS / QuickBird / OrbView / GeoEye and DMC/SPOT-1/-2 imagery,” IEEE TGRS, vol. 48, no. 3, pp. 1299 - 1325, 2010. • MTBS: Eidenshenk, J., Schwind, B., Brewer, K., Zhu, Z., Quayle, B., & Howard, S. 2007. A Project for Monitoring Trends in Burn Severity. Fire Ecology, 3, 3-21 Potential burned areas cumulatively detected in the year 2002 for tile 02v05, showing the spectral category of each candidate burned pixel.