Structural Phylogenomic Analysis
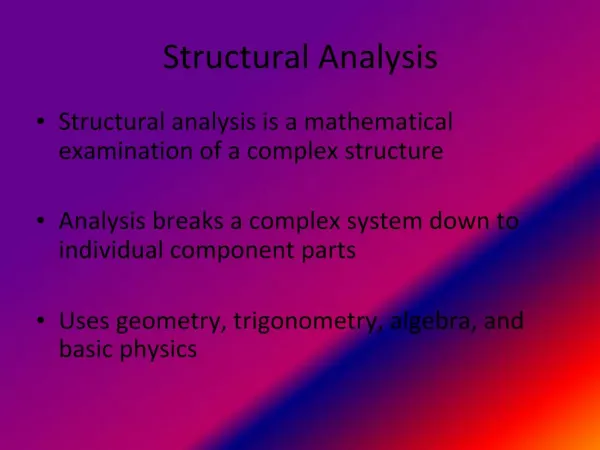
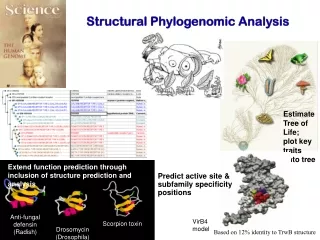
Estimate Tree of Life; plot key traits onto tree. Anti-fungal defensin (Radish). Scorpion toxin. Extend function prediction through inclusion of structure prediction and analysis. Predict active site & subfamily specificity positions. Drosomycin (Drosophila).


Structural Phylogenomic Analysis
E N D
Presentation Transcript
Estimate Tree of Life; plot key traits onto tree Anti-fungal defensin (Radish) Scorpion toxin Extend function prediction through inclusion of structure prediction and analysis Predict active site & subfamily specificity positions Drosomycin (Drosophila) Structural Phylogenomic Analysis VirB4 model Based on 12% identity to TrwB structure
Annotation transfer by homology • Status quo approach to protein function prediction • Given a gene (or protein) of unknown function • Run BLAST to find homologs • Identify the top BLAST hit(s) • If the score is significant, transfer the annotation • If resources permit, predict domains using PFAM or CDD • Problems: • Approach fails completely for ~30% of genes • Of those with annotations, only 3% have any supporting experimental evidence • 97% have had functions predicted by homology alone* • High error rate * Based on analysis of >300K proteins in the UniProt database
Database annotation errors Main sources of annotation errors: Domain shuffling Gene duplication (failure to discriminate between orthologs and paralogs) Existing database annotation errors Sub-functionalization Neo-functionalization Propagation of existing database annotation errors Errors in gene structure Galperin and Koonin, “Sources of systematic error in functional annotation of genomes: domain rearrangement, non-orthologous gene displacement and operon disruption.”In Silico Biol. 1998
BLAST against Arabidopsis Panther PFAM results Tomato Cf-2 Bioinformatics Analysis Domain fusion and fission events complicate function prediction by homology, particularly for particularly common domains (e.g., LRR regions). Domain structure analysis (e.g., PFAM) is often critical. Tomato Cf-2 (GI:1587673) Dixon, Jones, Keddie, Thomas, Harrison and Jones JDG Cell (1996) Top BLAST hit in Arabidopsis is an RLK!
Plant and Animal Innate Immunity Mediated by Structurally Similar Receptor and Receptor-like molecules TM Domain fusion/fission Cytoplasmic Toll Interleukin 1 Receptor (TIR) domain
Error presumably due to non-orthology of database hits used for annotation
Phylogenetic analysis suggests it’s more likely a Biogenic Amine GPCR
Phylogenomic inference Gene duplication in ancestral organism H1 C1 M1 R1 F1 W1 H2 C2 M2 R2 F2 W2 Human, Chimp, Mouse, Rat, Fly, Worm Eisen, 1998 Sjölander, Bioinformatics 2004
SCI-PHY analysis of selected GPCRs Venter et al, The sequence of the human genome (2001) Science. Sjolander, “"Phylogenomic inference of protein molecular function: advances and challenges," (2004) Bioinformatics
Phylogenetic reconstruction of protein families is complicated • Gene duplication • Domain shuffling • Lessening of evolutionary pressures associated with speciation and duplication enable significant structural and sequence changes • Different mutation rates in some lineages • Different types of constraints at some positions • Multiple sequence alignment errors • What members to include? (Some families contain thousands of members)
Caveats • Sequence “signal” guides the alignment • If the signal is weak, the alignment can be poor • As proteins diverge from a common ancestor, their structures and functions can change • Even structural superposition can be challenging! • Repeats, domain shuffling, large insertions or deletions can introduce alignment errors • If tree construction is the aim, errors in the alignment will affect tree accuracy!
Fundamental mechanisms underlying evolution of gene families
1BK8 Antimicrobial Protein 1 (Ah-Amp1) Common horse chestnut Homology and adaptation among protein families 1AGT Agitoxin 2 Egyptian Scorpion (K+ channel inhibitor) Drosomycin, Antifungal protein Fruit Fly 1CN2 Toxin 2 Mexican scorpion (Na+ channel inhibitor) 1AYJ Antifungal protein 1 (RS-AFP1) Radish
Protein superfamilies evolve novel forms and functions: Homology may be hard to detect from sequence similarity alone Homology detection and alignment accuracy (and %superposable positions!) drops with evolutionary distance Structure can provide clues, but not necessarily exact definition
A B B A C C A C B Not all positions in a molecule are created equal Light-blue positions are variable across subfamilies – but can be very conserved within subfamilies. These are the hallmarks of binding pockets determining substrate specificity.
Major differences between trees are in the coarse branching order A B B A C C A C B When each class, A, B and C appear equally similar to each other, the coarse branching order can be difficult to determine. In this case, it’s critical to be able to weight the subfamily-defining residues as more important when computing the distance between classes.
Seq1 M V V S - - P Seq2 M V V S T G P Seq3 M V V S S G P Seq4 M V L S S P P Seq5 M - L S G P P HMM construction using an initial multiple sequence alignment Delete/skip Insert Match
D S I F M K D S V F M K D T I W M K D T I W M K D T V W M K Profile or HMM parameter estimation using small training sets What other amino acids might be seen at this position among homologs? What are their probabilities? .
D S I F M K D S V F M K D T I W M K D T I W L K D T L W L R The context is critical when estimating amino acid distributions This position may be critical for function or structure, and may not allow substitutions .
Dirichlet Mixture Prior “Blocks9” Parameters estimated using Expectation Maximization (EM) algorithm. Training data: 86,000 columns from BLOCKS alignment database.
ˆ pi = the estimated probability of amino acid ‘i’ n = (n1,…,n20) = the count vector summarizing the observed amino acids at a position. j = (j,1 ,…, j,20 ) = the parameters of component j of the Dirichlet mixture . Combining Prior Knowledge with Observations using Dirichlet Mixture Densities Dirichlet Mixtures: A Method for Improved Detection of Weak but Significant Protein Sequence Homology. Sjolander, Karplus, Brown, Hughey, Krogh, Mian and Haussler. CABIOS (1996)
SATCHMO: Simultaneous Alignment and Tree Construction using Hidden Markov mOdels Xia Jiang Nandini Krishnamurthy Duncan Brown Michael Tung Jake Gunn-Glanville Bob Edgar Edgar, R., and Sjölander, K., "SATCHMO: Sequence Alignment and Tree Construction using Hidden Markov models," Bioinformatics. 2003 Jul 22;19(11):1404-11
SATCHMO motivation • Structural divergence within a superfamily means that… • Multiple sequence alignment (MSA) is hard • Alignable positions varies according to degree of divergence • Current MSA methods not designed to handle this variability • Assume globally alignable, all columns (e.g. ClustalW)… • Over-aligns, i.e. aligns regions that are not superposable • …or identify and align only highly conserved positions (profile HMMs) • Discards information important for subfamily specificity • Reality • Different degrees of alignability in different sequence pairs, different regions
Agglomerative clustering • Algorithm: Initialize all objects to be separate classes (leaves in the tree). Join “closest” classes (connecting each by edges to a node). Compute distance between new class and other classes. Join closest two classes. Iterate until all classes are joined into one class (a tree)
SATCHMO output • Tree • Cluster based on structural “distance” • Built simultaneously with alignments • Multiple sequence alignments • Different alignment for each cluster (=each node in tree) • Prediction of alignable / non-alignable regions • 1,2,3 mutually dependent, inform each other • Interact each time two clusters are combined Note: we can assess alignment quality, but assessment of tree topology accuracy is not straightforward to estimate.
SATCHMO algorithm: Progressive profile-profile alignment • Typical state: set of subtrees • Cluster (=subtree) contains • alignment of all subtree sequences • profile HMM • Initialization: each sequence forms a leaf in tree • Iterated step • Find most closely related pair of subtrees (using HMM scoring) • Align the MSAs of the two clusters using profile-profile alignment… • …treats MSA column as single “letter”, keeps columns intact • Result: new cluster with its own MSA • Predict “alignable” columns, and build profile HMM (w/Dirichlet mixture densities).
Assessing sequence alignment with respect to structural alignment Xia Jiang Duncan Brown Nandini Krishnamurthy
Summary • SATCHMO is designed to provide for the assumption of ‘positional homology’ during the tree estimation process • This assumption -- that we can predict the structurally equivalent positions from sequence information alone -- needs to be tested • We need a benchmark dataset to evaluate phylogenetic tree topology estimation