Download
1 / 48
480 likes | 624 Vues
This presentation explores the role of total lightning activity, particularly intracloud lightning, as a precursor for severe weather events, including microbursts and tornadoes. It highlights findings from field experiments and radar measurements conducted in the U.S., emphasizing how changes in lightning rates can forecast severe weather phenomena. The study integrates data from various sources, including Doppler radar and lightning detection systems, to enhance predictive capabilities for aviation safety and regional weather forecasting, illustrating the importance of lightning in the understanding of atmospheric dynamics.

E N D
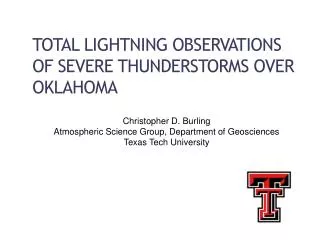
Total Lightning Activity as Diagnostic for Severe Weather Earle R. Williams INPE Rio de Janerio, Brazil July 25-28, 2005
Outline • Experience with Thunderstorm Microbursts (Alabama, Florida; 1980s) • Experience with Severe Weather(Florida; 1990s) • Lightning and Severe Weather over the Continental U.S.(2000+)
Intracloud and Cloud-to-Ground Lightning:A Key Distinction Intracloud Lightning Cloud-to-Ground Lightning
100 10 1.0 0.1 10 100 1000 10000 Behavior of Intracloud and Cloud-to-Ground Lightning IC/CG Ratio 105 Flashes/km2/15 min(Ground Flash Rate)
National Response to Microburst Accidents • Regional field experiments to study the problemDoppler radar measurements Surface Mesonet arrays Corona point sensors Lightning interferometer system • Development and deployment of Terminal Doppler Weather Radars (TDWR)
Total Lightning Rate Precedes Microburst Outflow & Cloud-to-Ground Rate Does Not
The LISDAD Project (1996 – 1999) • Integration of multiple observations into one real-time system: • Lincoln Laboratory ITWS • Melbourne NEXRAD radar • Orlando TDWR radar • National Lightning Detection Network • Lightning Detection and Ranging System (NASA KSC)
Pilots TDWR NEXRAD ASR-9 Microburst Prediction ITWS Real-time Processor Gust Front Prediction Storm Location & Motion Storm Cell Information Controllers Terminal Winds Tornado AWOS/ASOS Supervisors Traffic Managers – TRACON Airlines – ARTCC TMU LLWAS – Dispatch CWSU Aircraft Lightning – Ramp Tower Integrated TerminalWeather System (ITWS)
What is ‘Severe’ Weather? • Formal thresholds in the U.S. • Hail diameter > ¾ inch • or, Wind speed > 50 knots • or, Tornado on the ground
100 50 20 10 Particle Fall Speed (m/sec) 5 2 Non-Severe Severe 1 1 2 5 10 20 50 100 Particle Diameter (mm) Fallspeed of Hail vs. Size
Updraft Strength is the Key Quality • Supplier of super-cooled water • Driver of cloud electrification and lightning • Origin of hail growth and the thunderstorm ice factory • Source of vortex stretching and tornado genesis
Processes Aloft Naturally Precede Events at the Surface • Accretion of supercooled water in updraft precedes arrival of large hail at the surface • Active intracloud lightning aloft precedes cloud-to-ground lightning at the surface • Mesocyclonic rotation aloft precedes the tornado at the surface
Total Lightning Precursor to 1” Hailand Strong Outflow 350 300 250 200 Lightning (LDAR) Flash Rate (min-1) 150 100 50 0 1-inch Diameter Hail on Ground 70 22 May 1997 Isolated Severe Storm 1-inch Hail Orlando, Florida 60 50 40 30 Differential Velocity (knots) 20 10 0 1930 1810 1830 1850 1910 Time (UT)
Total Lightning Precursor to a Tornado Goodman (2004)
Low Cloud Base High Cloud Base W W Effect of cloud-base height on updraft width Less dilution by mixing Dynamic Effect of Cloud Base Height on Updraft Intensity and Lightning Activity
Clustered Positive Ground Flashes in Severe Weather Curran and Rust (1992) Branick and Doswell (1992) Seimon (1993) Stolzenburg (1994) MacGorman and Burgess (1994) Knapp (1994) Later work in STEPS (2000) provided strong evidence that such storms were inverted in polarity relative to ordinary thunderclouds.
Important Advances in Steps in 2000 • Development and implementation of VHF lightning mapping techniques for identifying the polarity of the lightning ‘tree’ (New Mexico Tech) • Inverted polarity storms characterized by large dew point depressions / low relative humidity • Rust and MacGorman (2002) • Wiens et. al. (2003) • Lang et. al. (2004)
Takahashi (1978) Pereyra et al (2000) Saunders et al (1991) Laboratory Simulations Temperature / Cloud Water Diagrams
Microphysical Effect of Cloud Base Height onLiquid Water Content Aloft Low Cloud Base High Cloud Base W W 0° C Cloud water loss by coalescence Superadiabatic loading in warm rain region
4” and Larger Hail Events(1955 – 1994) (Polston, 1996)
Climatology of Wet Bulb Potential Temperature (Noontime – July)
Inverted Polarity CloudsIs it Aerosol, or is it Hot, Dry Conditions? May, 1998 (Lyons et al, 1998) (Smith et al, 2003)
Conclusions • Total lightning activity (dominated by intracloud lightning) is a natural precursor to microbursts and severe weather at the surface • Cloud to ground lightning has relatively little benefit to this endeavor • Recipe for inverted polarity and extraordinary total lightning activity: High cloud base height AND appreciable instability
1500 m 1000 m 500 m Ocean RH = 80% Rondonia Wet Season RH = 70% Rondonia Premonsoon RH = 60% Thermal Width/Updraft Width Scaling with Boundary Layer Depth?
W Cape 0° C Large Cape Strong Updraft Bounded Weak Echo Region VHF Radiation “Holes” The Role of Strong Instability in Promoting High Liquid Water Content
Cross-section of Dryline Ziegler and Rasmussen, (1998)
Delay of First NLDN Ground Flashfrom First LDAR Lightning in Storm Mean Delay = 11 minutes 20 15 10 Number of Observations 5 0 0 10 20 30 40 50 60 Delay (min)
Microburst Accidents Prompting Attention • New Orleans, Louisiana – July 9, 1982 • Dallas / Ft. Worth, Texas – August 2, 1985
Lightning Flash Rate vs Thermodynamics (Tropical Afternoon Storms Over Land)