Download

1 / 28
290 likes | 533 Vues
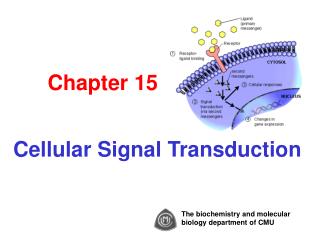
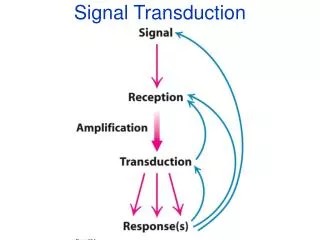
USE OF ELICITOR SETS TO CHARACTERIZE CELLULAR SIGNAL TRANSDUCTION. Graduate Student: Arthi Narayanan Major Professor: Dr. Frank Chaplen. Outline. Background Experimental Methods Results & Discussion. Background. Complexities of signal transduction pathways. What is systems biology?.

E N D
USE OF ELICITOR SETS TO CHARACTERIZE CELLULAR SIGNAL TRANSDUCTION Graduate Student: Arthi Narayanan Major Professor: Dr. Frank Chaplen
Outline • Background • Experimental Methods • Results & Discussion
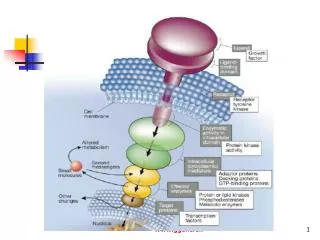
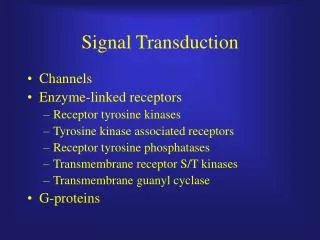
What is systems biology? Does not investigate individual genes or proteins, but investigates the behavior and relationships of all of the elements in a particular biological system while it is functioning. Study of a biological system by a systematic and quantitative analysis of all of the components that constitute the system. • Biological information has several important features: • Operates on multiple hierarchical levels of organization. • Processed in complex networks. • Key nodes in the network where perturbations may have profound effects; these offer powerful targets for the understanding and manipulation of the system.
Problem Statement • Use the elicitor method - an experimental framework designed to monitor information flows through the G-protein signal transduction network. • To derive mechanistic interpretations from the action of Phenylmethylsulfonyl Fluoride (PMSF), a serine protease inhibitor and nerve agent analog. • Model System: Fish Chromatophores
Aggregation/Dispersion of Fish Chromatophores Before and after 100 nM Clonidine Before and after 10 µM Forskolin
Elicitor sets method • What is an elicitor panel? • Known effectors of checkpoints in the signaling cascade. • Elicitor = effector + application method • Why elicitor sets? • Enable identification of the key nodes in the signaling pathway • Segregation of the pathway into different modules • Perturbation of the signaling cascade by adding different effectors will help investigate the cross-talk mechanisms • Enable signature identification of biologically active compounds
A B 20-D mechanism space defined by elicitor panel described below and represented as 3-D projection (A) Cluster map for PMSF; (B) Cluster map for BC 1; (C) Cluster map for BC 5; (D) Cluster map for BC 6. The cluster map for each agent represents a unique complex signature defined by its biological mechanism of action. Elicitors are clonidine (100 and 50 nM), melanin stimulating hormone (10 nM) and forskolin (100 µM). C D
as IP3 DAG bg bg cAMP PKC PKA AC PLC Cross-talk between Gs and Gq pathways aq PLC PLC R R Ca2+
bg bg ai aq AC PLC IP3 DAG cAMP R Ca2+ PKC PKA Cross-talk between Gi and Gq pathways
EXPERIMENTAL SET-UP Day 0: Plated cultured fish chromatophores in 24 well plates Day 1: Media change Day 2: Experiments Measured OD of cells at ground state Exposed cells to 10 µM forskolin for 24 minutes with OD being measured at regular intervals Added 1 mM PMSF to cells and measured OD values for 2.77 hours Added secondary elicitors (1&100 µM H89, 1&100 µM cirazoline, 100 nM clonidine) and monitored the response for 42 minutes. Plotted normalized % change in OD Vs Time
Table 1: List of agents used with their concentrations and response patterns
Dilution curves for Clonidine, Cirazoline and L-15 control
Segmentation of the cAMP pathway by application of forskolin as the primary elicitor
Elicitor experiments with PMSF applied after forskolin
Gq Cirazoline PLC PIP2 IP3 + DAG Ca++ PKC Aggregation TARGETS FOR PRIMARY AND SECONDARY ELICITORS Clonidine Gi AC Forskolin cAMP PKA H89 Aggregation
Mechanistic interpretation from PMSF action • %OD change due to H-89 in: • wells treated with PMSF - 26% • control wells - 44% • Our experimental results predict that PMSF acts at or downstream of PKA. • An interpretation of the results suggests an interaction between a serine protease and PKA, that makes the latter less susceptible to H89. • When PMSF, a serine protease inhibitor is added to the cells, this interaction is hampered thereby allowing H-89 to totally exert its inhibitory effect on PKA.
Discussion and Conclusion • Choice of AC as reference node and forskolin as primary elicitor simplifies the determination of the mechanism of action of PMSF. • Application of PMSF after forskolin localized the measurable effect of PMSF to regions of the signaling cascade, below AC • Perturbation by addition of secondary elicitors provided more information within the simplex scenario created by forskolin. • Increased information resolution is evident in the heightened sensitivity of PKA to H-89 in the presence of PMSF, while the upper segment of the pathway is decoupled through application of forskolin • help identify cross-talks. Failure of cirazoline to elicit a response when applied after forskolin shows an evidence of cross-talk.
Thanks To: • Dr.Frank Chaplen for his indispensable support and guidance at every step during my research. • Dr. Rosalyn Upson for her guidance and encouragement. • Elena, Linda, June, Ruth, Christy, Bob and Indi for all your help along the way. • Dr.Michael Schimerlik and Dr. Skip Rochefort for serving on my committee. • Jeanine Lawrence, Ljiljana Mojovic and Ned Imming for your help in the lab. • Ganesh and my family back in India for everything. • NSF and AES for funding this work.