Download
1 / 57
570 likes | 587 Vues
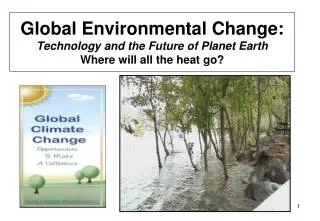
Global Environmental Changes: Technology and the Future of Planet Earth. Eugene S. Takle, PhD, CCM Professor of Atmospheric Science Professor of Agricultural Meteorology Iowa State University Ames, Iowa 50011 gstakle@iastate.edu. College for Seniors, 10 April 2006. Outline.

E N D
Global Environmental Changes: Technology and the Future of Planet Earth Eugene S. Takle, PhD, CCM Professor of Atmospheric Science Professor of Agricultural Meteorology Iowa State University Ames, Iowa 50011 gstakle@iastate.edu College for Seniors, 10 April 2006
Outline • Changes in atmospheric carbon dioxide • Radiative forcing • Simulations of global climate and future climate change • “Dangerous anthropogenic inter- ference with the climate system”? • “Climate surprises” • Summary
2040 Carbon Dioxide and Temperature 2006
Carbon Dioxide and Temperature Stabilization at 550 ppm
Carbon Dioxide and Temperature “Business as Usual” (fossil intensive) 2100
“Nobody believes that the US economy can still be petroleum based in 2050, yet there is no national plan” Mark Kushner, Dean Iowa State University College of Engineering President’s Council Meeting 13 January 2006
El Chichon (1982) Agung, 1963 Mt. Pinatubo (1991) Hansen, Scientific American, March 2004
Source: IPCC, 2001: Climate Change 2001: The Scientific Basis
Source: IPCC, 2001: Climate Change 2001: The Scientific Basis
Associated Climate Changes • Global sea-level has increased 1-2 mm/yr • Duration of ice cover of rivers and lakes decreased by 2 weeks in N. Hemisphere • Arctic ice has thinned substantially, decreased in extent by 10-15% • Reduced permafrost in polar, sub-polar, mountainous regions • Growing season lengthened by 1-4 days in N. Hemisphere • Retreat of continental glaciers on all continents • Poleward shift of animal and plant ranges • Snow cover decreased by 10% • Earlier flowering dates • Coral reef bleaching Source: Intergovernmental Panel on Climate Change, 2001 Report
NASA photographs show the minimm Arctic sea ice concentration in 1979 at left and in 2003.Satellite passive microwave data since 1970s indicate a 3% decrease per decade in arctic sea ice extent.
Since 1979, the size of the summer polar ice cap has shrunk more than 20 percent. (Illustration from NASA) (http://www.nrdc.org/globalWarming/qthinice.asp)
Tropical Atlantic Ocean Hurricane Power Dissipation Index (PDI) Sea-surface temperature V V V Emanual, Kerry, 2005: Increasing destructiveness of tropical cyclones over the past 30 years. Nature, 436, 686-688.
Tropical Atlantic Ocean Hurricane Power Dissipation Index (PDI) Sea-surface temperature V V V Emanual, Kerry, 2005: Increasing destructiveness of tropical cyclones over the past 30 years. Nature, 436, 686-688.
Tropical Weather Weather Underground: http://www.wunderground.com/tropical/
http://en.wikipedia.org/wiki/Image:Katrina_vs_sea_surface_height.JPGhttp://en.wikipedia.org/wiki/Image:Katrina_vs_sea_surface_height.JPG
Source: Jerry Meehl, National Center for Atmospheric Research
Source: Jerry Meehl, National Center for Atmospheric Research
Source: Jerry Meehl, National Center for Atmospheric Research
The planet is committed to a warming over the next 50 years regardless of political decisions Source: National Center for Atmospheric Research
The planet is committed to a warming over the next 50 years regardless of political decisions Mitigation Possible Adaptation Necessary Source: National Center for Atmospheric Research
Source: Intergovernmental Panel on Climate Change, 2001 Report
40% Probability 5% Probability Source: Intergovernmental Panel on Climate Change, 2001 Report
Climate Change Projected for 2100 Rapid Economic Growth Slower Economic Growth
Source: Corell, R. W., 2004: Impacts of a warming Arctic. Arctic Climate Impact Assessment (www.acia.uaf.edu) Cambridge University Press (www.cambridge.org).
IPCC Summary for Policy Makers • An increasing body of observations gives a collective picture of a warming world and other changes in the climate system • Emissions of greenhouse gases and aerosols due to human activities continue to alter the atmosphere in ways that are expected to affect the climate
IPCC Summary for Policy Makers, cont’d • There is new and stronger evidence that most of the warming observed over the last 50 years is attributable to human activities • Anthropogenic climate change will persist for many centuries
For the Midwest • Warming will be greater for winter than summer • Warming will be greater at night than during the day • A 3oF rise in summer daytime temperature triples the probability of a heat wave • Growing season will be longer (8-9 days longer now than in 1950) • More precipitation • Likely more soil moisture in summer • More rain will come in intense rainfall events • Higher stream flow, more flooding
Climate Surprises • Breakdown of the ocean thermohaline circulation (Greenland melt water) • Break-off of the West Antarctic Ice Sheet
Kennedy Space Center Areas subjected to Inundation with a 1 m (~3 ft) rise in sea level Miami
What Constitutes “Dangerous Anthropogenic Interference with the Climate System”? James Hansen, Director of the NASA Goddard Institute for Space Studies: * Radiative forcing limit: 1 Watt/ m2 * 1 oC additional rise in global mean temperature
El Chichon (1982) Agung, 1963 Mt. Pinatubo (1991) Hansen, Scientific American, March 2004
El Chichon (1982) Agung, 1963 Mt. Pinatubo (1991) Imbalance = 1 Watt/m2 in 2018 Hansen, Scientific American, March 2004