Resolving patterns in low level phosphorus concentrations
This study explores the dynamics of phosphorus (P) in Lake Superior, analyzing its concentrations and their correlation with ecosystem health. Utilizing advanced analytical techniques, including a fluorometric method, we assess both total phosphorus (TP) and its component forms, highlighting the importance of P as a limiting nutrient in this oligotrophic lake. Observations suggest that P concentrations vary spatially and temporally, with implications for nutrient management and monitoring. The findings underscore the necessity of focused phosphorus tracking, given its critical role in aquatic productivity and health.
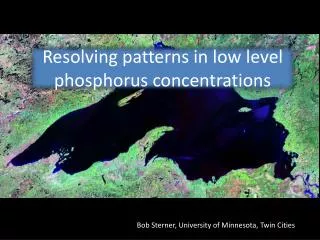

Resolving patterns in low level phosphorus concentrations
E N D
Presentation Transcript
Resolving patterns in low level phosphorus concentrations Bob Sterner, University of Minnesota, Twin Cities
(Improved methods for ammonium) Holmes et al. CJFAS 1999 Developed fluorometric method. Single working reagent (OPA). Kumar et al. JGLR 2007 Applied to Lake Superior to resolve spatial and temporal patterns Taylor et al. 2007, JNABS Improved accounting for ME.
Recall: TP = TDP + PP Total Total Dissolved Particulate
We believe the Lake Superior ecosystem is P-driven. Lakes with low [TP] exhibit high P stress. From this standpoint, P should be a monitoring priority. For example: Guildford and Hecky L&O 2000 (Superior = “9”)
Bottle bioassays. Responses to P (plus and minus) Responses to Fe (minus only) As an oligotrophic lake with excess nitrate and high Si we fully expect phosphorus to be the main limiting nutrient in Lake Superior. Not much study though. (Try a Google Scholar search on “phosphorus Lake Superior” to convince yourself.) Sterner et al. L&O 2004
Inverse relationship between % sulfolipids and % P lipids. Most epi samples had high S/low P lipids. Recent work from colleagues suggesting P stress in surface organisms. Biomoleculardifferences between seston of the epilimnetic and deep chlorophyll maxima layers of Lake Superior Brent J. Bellinger, Benjamin A. S. Van Mooy, James B. Cotner, Helen F. Fredricks, Claudia Benitez-Nelson, Jo Thompson, Anne Cotter, Michael Knuth, Casey M. Godwin In prep.
If phosphorus is the main chemical element determining Lake Superior ecosystem dynamics, we should know something about its sources, sinks, and patterns in space and time. (Wiki commons) P sinks as part of particulate matter but we don’t run out of P in the mixed layer. Downward flux must be offset by some kind of upward vertical flux. Internal resupply in the lake – depends on concentrations with depth.
But what do we know about concentrations of different P forms in Lake Superior?
State of the art for P pools is to present ranges and means or medians. * TP µM Values only a few X higher than MDL, so we can say that concentrations are > 0 but there is small hope to resolve differences over the lake. TDP µM *Some values summarized by Urban 2009 in State of Lake Superior; others USEPA unpublished Great Lakes Water Quality Monitoring 1983-2008, A&S from original source.
With particulate phosphorus we stand a better chance because we can load filters with high concentrations. Previous studies by others suggests PP is about half the TP. Sterner, Inland Waters 2011
New improvements in TP and TDPFreeze Dry Preconcentration (unpublished) Whole water or 0.2 um filtered lake water frozen in TMC, MilliQ- rinsed plastic bottles. Typical vol. = 500 mL. After thawing, 50-80 mL transferred into TMC-cleaned glass bottles. These capped and frozen in standard lab freezer until solid. Bottles uncapped, covered with Nitex mesh, and placed in -40 C freeze drier for 3 d until water fully sublimated. Powder resuspended in 7 mL of potassium persulphate and autoclaved at 30 min. P determined by ascorbic acid method.
Site WM, June 2010 Some high intensity water column sampling coupled to high-precision analytical methods. 1. DCM certainly present but a lot of it is adjustment of chl:C ratios. 2. Some slight drawdown of ammonium in shallower depths. 3. Most TP is dissolved. No evidence of vertical stratification in P pools early in season. And note value of high intensity sampling of the water column. Include this for a small number of index stations?
Site WM, August 2010 Later in the year, same station. 1. DCM still present, still C:chl important. 2. Nitrate drawdown is very obvious; ammonium now higher in shallower depths. 3. Most TP is dissolved. TP highest in surface waters.
A more expanded seasonal view at site WM. Except for May, TP is higher in shallow than deeper depths. Mystery! How does it move and remain in surface? These TP values do not change the previously reported ranges. Very similar. But spatial patterns are becoming clearer.
What governs the movement of P in and out of trophogenic zone in Lake Superior? What are the forces concentrating P in the mixed layer, opposing gravitational losses due to sinking? (Wiki commons) Supply:demand can still mean P is less relatively available in upper layers.
So we’ve begun to resolve some of the in-lake dynamics of what we think is a key limiting element and early results are surprising. But how much do we really know about P as a fuel for production in Lake Superior?
It seems certain that P is a master controlling variable in this oligotrophic lake, but… there are weak couplings between amounts of P and C in biomass. In other words, seston C:P ratios fluctuate widely. Perhaps not so obvious how P relates to trophic state at daily/seasonal scales.
Conclusions and recommendations There have been (and still are!) serious analytical challenges in the Upper Great Lakes. Documenting patterns of nutrient concentrations in space and time is important for our understanding and to evaluate changes over time. There are analytical approaches that go beyond classical methods to increase signal:noise. These require greater investment of time/energy/resources but they aren’t exotic. As part of the 2016 work, serious efforts to involve measurements using improved analytical methods should be incorporated.