National Integrated Drought Information System
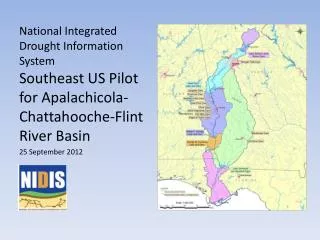
National Integrated Drought Information System. Southeast US Pilot for Apalachicola- Chattahooche -Flint River Basin 25 September 2012. Outline. Welcome – Keith Ingram, UF, Southeast Climate Consortium Current drought status and how we got here – David Zierden, FSU, Florida Climate Center

National Integrated Drought Information System
E N D
Presentation Transcript
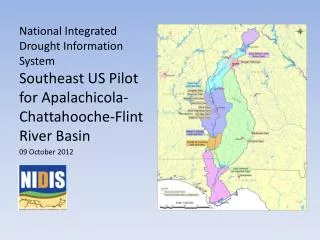
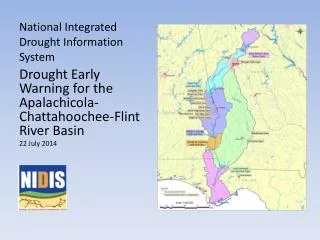
National Integrated Drought Information System Southeast US Pilot for Apalachicola-Chattahooche-Flint River Basin 25 September 2012
Outline Welcome – Keith Ingram, UF, Southeast Climate Consortium Current drought status and how we got here – David Zierden, FSU, Florida Climate Center Streamflows and groundwater – Tony Gotvald, USGS Summary of lake conditions – Bailey Crane Seasonal outlooks – David Zierden Streamflow forecasts – Todd Hamill, SE River Forecast Center New Agricultural Drought Products – Jon Case Summary and Discussion
Current drought status from Drought Monitor http://www.drought.unl.edu/dm/monitor.html
Cumulative Rainfall Deficits Past 30 days Since Oct. 1 http://water.weather.gov/precip/
Realtime stream flow compared with historical monthly averages Current: Previous Brief: http://waterwatch.usgs.gov
Below Normal 7-day Average Streamflows Previous brief: Below normal 7-day average streamflowas compared with historical streamflow for day shown Current: http://waterwatch.usgs.gov
Lake Lanier Inflows Chestatee near Dahlonega (02333500) Chattahoochee near Cornelia (02331600) http://waterwatch.usgs.gov
Current Streamflows Chattahoochee at West Point (02339500) Flint at Bainbridge (02356000) http://waterwatch.usgs.gov
Streamflows Apalachicola at Chattahoochee (02358000) http://waterwatch.usgs.gov
Groundwater Status Miller County, GA (Upper Floridan Aquifer) http://groundwaterwatch.usgs.gov
5-Day Precipitation Forecast http://www.hpc.ncep.noaa.gov/qpf/day1-5.shtml
7-day average Pacific Ocean SST Anomalies http://www.cpc.ncep.noaa.gov/products/precip/CWlink/MJO/enso.shtml
1-3 Month Precipitation Outlook 3 Month 1 Month
1-Month Streamflow Forecasts Apalachicola Watershed Southeast River Forecast Center Lake Lanier Inflows September 24th – October 24th 2012 Whitesburg Lovejoy Above Normal Carsonville West Point Near Normal Columbus Below Normal Albany WF George Columbus Woodruff Blountstown
3-Month Mean Daily Streamflow Forecasts Apalachicola Watershed Southeast River Forecast Center Lake Lanier Inflows September 24th – December 24th 2012 Whitesburg Lovejoy Above Normal Carsonville West Point Near Normal Below Normal Columbus WF George Albany Columbus Woodruff Blountstown
Week of May 29th, 2012 Week of June 5th, 2012
Note precipitation has removed drought stress over most of region even though hydrologic drought is still high in central Georgia Week of June 12th, 2012 Week of June 19th, 2012 Note high temperatures and lack of rainfall has produced drought stress in North Alabama
Note high temperatures and lack of rainfall has produced continual drought stress on corn. Final yield data indicates that North Alabama even though never above D2 drought category had substantial harm. Week of June 26th, 2012 Week of July 3rd, 2012
Weekly Soil Moisture Measurement and vegetative Index (LIS) Figure 12: Weekly Vegetative Index (LIS) Long-term drought indicators versus short-term crop stress A very important issue that became apparent through the 2012 growing season was the disparity between long-term drought indicators and short-term, drought-induced crop-stress. The national drought monitor takes into account a wide variety of factors when defining the level of drought for an area. The factors used take a “long look”, using information such as aquifer levels that do not respond to short-duration droughts. While this is important, it often cannot capture “crop-related drought” brought one by relatively short-term lack of precipitation. These short-term droughts are exacerbated in some regions because of the poor water-holding capacity of the soils. The following is a time-sequence including the weekly national drought monitor, GriDSSAT corn crop stress and cumulative precipitation. All map sets are for the same 7-day period. Note that during the week of May 29th (Figure 13), there is wide-spread drought and crop stress. But over the course of the next two weeks, precipitation all but eliminates the short-term crop stress (Figures 14 & 15); while the drought monitor is still intense in south-east Alabama and south-west Georgia. But then, starting the week of June 19th, the region goes into an intense, hot, dry period (Figure 16). By the first week of July, a majority of the corn crop has been lost in northern Alabama (the highest corn-producing region of the state). Yet, the drought monitor does not reflect the crop loss. We are in the process of working with the US Drought Monitor and State Climatologists on this case study as an example for the need of additional products to characterize agricultural drought. Figure 13: Week of May 29th, 2012 Figure 14: Week of June 5th, 2012 Figure 15: Week of June 12th, 2012 Figure 16: Week of June 19th, 2012
Summary Drought persists in most of the basin in AL and GA, which is classified as in severe to exceptional drought in the latest drought monitor Rainfall during the previous 7 days has been 2 inches or less for the entire basin. Streamflowsand groundwater levels, especially in the southern part of the basin, continue to be still critically low
Summary The 5-day rainfall forecast calls for less than 0.5 inches across the basin, which indicates that drought will continue to worsen in the near term Equatorial Pacific Ocean temperature anomalies and models still indicate the likelihood that El Niño will develop during the fall, with the 1-3 month precipitation outlook calling for above normal rainfall and the drought outlook calling for some improvement of drought conditions in the basin
Summary The 1-month and 3-month streamflow forecasts have not changed much since the last briefing, with all forecasts for below normal streamflow levels and a greater than 50% probability of below normal streamflows for all locations in the 3-month forecast New agricultural drought products show the impacts of drought on crops as well as the amount of water crops demand for irrigation
References Speakers David Zierden, FSU Tony Gotvald, USGS Bailey Crane, US ACE Jeff Dobur, SERFC Jon Case, NASA Moderator Keith Ingram, UF/SECC Additional information • General drought information • http://drought.govhttp://www.drought.unl.edu • General climate and El Niño information http://agroclimate.org/climate/ • Streamflow monitoring & forecasting • http://waterwatch.usgs.gov • http://www.srh.noaa.gov/serfc/ • Groundwater monitoring • http://groundwaterwatch.usgs.gov
Thank you! Next briefing 9 October 2012, 1:00 pm EST Slides from this briefing will be posted at http://www.drought.gov/portal/server.pt/community/acfrb Please send comments and suggestions to: ktingram@ufl.edu