Download
1 / 20
200 likes | 399 Vues
H1. IDENTIFY THE POSSIBLE VARIABLES IN THE FOLLOWING EXPERIMENTAL HYPOTHESES: 1. The greater the amount of light, the taller the plants will grow. Independent Variable: Dependent Variable: Controlled Variables: Control Test:

E N D
IDENTIFY THE POSSIBLE VARIABLES IN THE FOLLOWING EXPERIMENTAL HYPOTHESES: • 1. The greater the amount of light, the taller the plants will grow. • Independent Variable: • Dependent Variable: • Controlled Variables: • Control Test: • 2.The greater the amount of salt added to ice, the lower the temperature of the mixture of water. • Independent Variable: • Dependent Variable: • Controlled Variables: • 3. Make up your own experimental prediction from any area that interests you and identify the variables: • Prediction: • Independent Variable: • Dependent Variable: • Controlled Variables: • Control Test (if applicable): H1a
H5b Fold Line Fold Line Paper clip Cut Fold Fold Fold Fold Back Fold Back Fold Back Chopper B Fold Front Fold Front Fold Front Fold Fold Fold Cut Cut Cut
Data Table: Graph Results (Indep – x-axis; dep – y-axis): Conclusion: ________________________ Application: ________________________ H5c
Bibliography H8
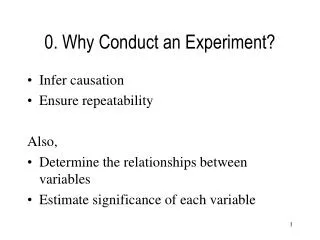
SCIENCE PROJECT ON BACKBOARD DUE:_____________ • This project is an experiment designed to solve a specific problem which • includes a manipulated variable, a responding variable, and controlled variables. In some experiments this will also include a control group which is used for comparison (example: plants with no fertilizer to compare the effects of fertilizer on plant growth). The Scientific Method has been taught in class and all steps have been modeled in a classroom experiment. Students are to apply the Scientific Method to an area in which they have an interest or go either of their parent's occupations or hobbies. • BACKBOARD INCLUDES • DUE DATES • Background Report and Bibliography. A 2 page report with the 3rd page being the bibliography. Three • references are required. Students are working on this • ________ 2 TYPED COPIES in class: taking notes, writing the bibliography infor- • mation, writing rough, and final draft in class________. The final draft must be typed to place on backboard • ______________________________________________________________________ • PROBLEM: • What is the effect of ______on ________? • Does _________affect _________? • Independent Variable: What you change or study • Dependent Variable: What you measure occurred • as a result of what was changed or what you chose to • study. • _____________ Controlled Variables: Things which were kept the same • HANDOUT Completed in to insure that they did not affect the results. • ink or typedControlled Test: A sample which was not treated with • the manipulated variable, example: Plants with no • fertilizer. (NOT ALL EXPERIMENTS HAVE THIS). • HYPOTHESIS: Educated guess about the effect of • the manipulated variable on the responding variable. • (Example: The __________(will, will not) affect_______. • PROCEDURE: Numbered, detailed directions so complete • that someone reading the directions could duplicate it. • DATA TABLE "DESIGNED" ready to record data. • ______________________________________________________________________ • ________data so far 6. DATA: Measurements or observations recorded on a • ________2 COPIES final table "data table" or organized chart. • ______________________________________________________________________ • ________2 COPIES 7. GRAPH: Bar, Line, or Pie Graph of the data (2 copies) • CONCLUSION: States how the manipulated variable • affected the responding variable. Example: The • day of the week (did , or did not) affect the number of • patients admitted to the emergency room because…. • APPLICATION: Explain how this information could be applied in the real world . • _______________________________________________________________________ • __________3 COPIES 10. ABSTRACT: (FOLLOW HANDOUT DIRECTIONS) H