INDUSTRIAL WATER POLLUTION CONTROL
420 likes | 672 Vues
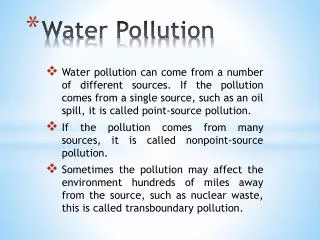
INDUSTRIAL WATER POLLUTION CONTROL. Ass. Prof. Dr. Erkan ŞAHİNKAYA. Source and characteristics of Ind. WW. Undesirable WW may include; Soluble Organics Suspended solids Priority pollutants Heavy metals Color and turbidity N and P Refractory organics Oil and grease

INDUSTRIAL WATER POLLUTION CONTROL
E N D
Presentation Transcript
INDUSTRIAL WATER POLLUTION CONTROL Ass. Prof. Dr. Erkan ŞAHİNKAYA
Source and characteristics of Ind. WW Undesirable WW may include; • Soluble Organics • Suspended solids • Priority pollutants • Heavy metals • Color and turbidity • N and P • Refractory organics • Oil and grease • Persistent organics (such as DDT) • Emerging Pollutants (Pharmaceuticals, personal care products, endocrine disrupting compounds)
Flow rate and waste characteristics show great variation depending on • Diversity of product manufactured • Process operation (batch or continuous) • Housekeeping Short term (diurnal) and long term (seasonal) variations are observed.
Example Using the measured data for BOD plot frequency of occurrence curve First value = 100/(2*n)
The general procedure to develop necessary information • Develop a sewer map and point sampling locations for flow measurement and characterization • Establish sampling and analysis schedule. Continuous samples with composites weighted according to flow are the most desirable. But difficult.Continuous processes can be sampled hourly and composited on an 8-, 12- or 24-h basis. • Develop a flow and material diagram • Establish a statistical variations for flow and waste characteristics
Establishing analysis… • The analyses to be run depend on the parameter and purpose. • pH should be measured on grab samples since it can be neutralized in composite samples and mislead for design. • BOD: 8-h or shorter composites. • For nutrient removing systems N and P should be measured on 24-h composites. • Frequency of occurrence is important in statistical analysis
….Composite sampling • User-friendly programming • for all applications • basic and extended programming modes provides • program your sampler for: • Uniform time intervals • Non-uniform time intervals • Flow-paced sampling with or without time delay Isco 3710C Compact Portable Composite Sampler
Flow Masurement • Depends on physical location of sampling • If water flows through a sewer then calculate velocity, measure water depth and Q=V.A • The area can be calculated from depth of water • Vavrg=0.8*Vsurf • Vsurf is measured using a floating object between two manholes or use a current meter
….flow measurement • In a channel flow can be measured by using veirs or measuring velocity and calculating wet area. • Use pumping rate for flow measurement • Water consumption can be used to estimate wastewater flow • Infiltration and exfiltration should be considered. The water loss from sewer can be calculated based on; • Drainage area (0,1-0,2 l/sn.ha) • Length of sewer (0,80 l/sn.km) • Both length and diameter of sewer (0,5-5 m3/d.km.cm)
If Low flow is expected…. • When plant is operating well below the design capacity, particularly during the initial years of operation, recycling treated effluent may be considered. Treatment Plant
Flow measurement points • On the channels and control manhole • WWTP inlet • After screens, after grit removal or after primary sedimentation • Pump stations • Before discharge
PREDICTION OF DENIZLI WASTEWATER TREATMENT PLANT PERFORMANCE USING ARTIFICIAL NEURAL NETWORK MODELLING(A master thesis study supervised by Dr. Erkan SAHİNKAYA)
Thenumber of municipalitieshaving a municipal WWTP ; 238 @ 2001 322 @ 2002 362 @ 2006 436 @ 2008
DWWT Design Criteria • The WWTP was planned as two stages; 2005 and 2025 • The project flow rate at 2005 and 2025 are 692 lt/sn and 2806 lt/sn, respectively • The population at 2005 and 2025 are 378353 and 703838, respectively. • BOD5 loading 54 gr/person-day, • Total N loading 10 gr/person-day, • Total P loading 2 gr/person-day, • SS loading 140 gr/person-day.
MATERIAL AND METHODSMeasured parameters Grabsamples • Temperature - pH - Conductivity - Dissolved Oxygen 2h- and 24h- Composite samples - BOD - COD, - SS - SVI, - Total nitrogen - Total P The parameters predicted by ANN are effluent COD, BOD, total N, total P and SVI
Figure. The plant influent and effluent pH (a), temperature (b), conductivity (c) and SS (d)
Figure. SS at aeration tank and recycle line(a), SVI and effluent SS (c)
Table. The comparison of different scenarios for the ANN prediction of Effluent COD