Questions From Yesterday
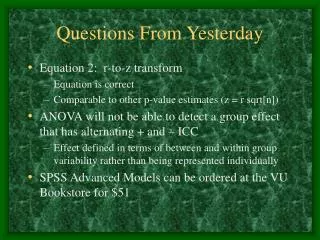
Questions From Yesterday. Equation 2: r-to-z transform Equation is correct Comparable to other p-value estimates (z = r sqrt[n]) ANOVA will not be able to detect a group effect that has alternating + and – ICC

Questions From Yesterday
E N D
Presentation Transcript
Questions From Yesterday • Equation 2: r-to-z transform • Equation is correct • Comparable to other p-value estimates (z = r sqrt[n]) • ANOVA will not be able to detect a group effect that has alternating + and – ICC • Effect defined in terms of between and within group variability rather than being represented individually • SPSS Advanced Models can be ordered at the VU Bookstore for $51
Hierarchical Linear Modeling (HLM) • Theoretical introduction • Introduction to HLM • HLM equations • HLM interpretation of your data sets • Building an HLM model • Demonstration of HLM software • Personal experience with HLM tutorial
General Information and Terminology • HLM can be used on data with many levels but we will only consider 2-level models • The lowest level of analysis is Level 1 (L1), the second lowest is Level 2 (L2), and so on • In group research, Level 1 corresponds to the individual level and Level 2 corresponds to the group level • Your DV has to be at the lowest level
When Should You Use HLM? • If you have mixed variables • If you have different number of observations per group • If you think a regression relationship varies by group • Any time your data has multiple levels
What Does HLM Do? • Fits a regression equation at the individual level • Lets parameters of the regression equation vary by group membership • Uses group-level variables to explain variation in the individual-level parameters • Allows you to test for main effects and interactions within and between levels
The Level 1 Regression Equation • Predicts the value of your DV from the values of your L1 IVs (example uses 2) • Equation has the general form of Yij = B0j + B1j * X1ij + B2j * X2ij + rij • “i” refers to the person number and “j” refers to the group number • Since the coefficients B0, B1, and B2 change from group to group they have variability that we can try to explain
Level 2 Equations • Predict the value of the L1 parameters using values of your L2 IVs (example uses 1) • Sample equations: B0j = G00 + G01 * W1j + u0j B1j = G10 + G11 * W1j + u1j B2j = G20 + G21 * W1j + u2j • You will have a separate equation for each parameter
Combined Model • We can substitute the L2 equations into the L1 equation to see the combined model Yij = G00 + G01 * W1j + u0j + (G10 + G11 * W1j + u1j) X1ij + (G20 + G21 * W1j + u2j) X2ij + rij • Cannot estimate this using normal regression • HLM estimates the random factors from the model with MLE and the fixed factors with LSE
Centering • L1 regression equation: Yij = B0j + B1j * X1ij + B2j * X2ij + rij • B0j tells us the value of Yij when X1ij = 0 and X2ij = 0 • Interpretation of B0j therefore depends on the scale of X1ij and X2ij • “Centering” refers to subtracting a value from an X to make the 0 point meaningful
Centering (continued) • If you center the Xs on their group mean (GPM) then B0 represents the group mean on Yij • If you center the Xs on the grand mean (GRM) then B0 represents the group mean on Yij adjusted for the group’s average value on the Xs • You can also center an X on a meaningful fixed value
Estimating the Model • After you specify the L1 and L2 parameters you need to estimate your parameters • We can examine the within and between group variability of L1 parameters to estimate the reliability of the analysis • We examine estimates of L2 parameters to test theoretical factors
Interpreting Level 2 Intercept Parameters • L2 intercept equation B0j = G00 + G01 * W1j + u0j • G00 is the average intercept across groups • If Xs are GPM centered, G01 is the relationship between W1 and the group mean (main effect of W1) • If Xs are GRM centered, G01 is the relationship between W1 and the adjusted group mean • u0 is the unaccounted group effect
Interpreting Level 2 Slope Parameters • L2 slope equation B1j = G10 + G11 * W1j + u1j • G10 is the average slope (main effect of X) • G11 is relationship between W1 and the slope (interaction between X and W) • u1 is the unaccounted group effect
Building a HLM Model • Start by fitting a random coefficient model • All L1 variables included • L2 equations only have intercept and error • Examine the L2 output for each parameter • If there is no random effect then parameter does not vary by group • If there is no random effect and no intercept then the parameter is not needed in the model
Building a HLM Model (continued) • Build the full intercepts- and slopes-as-outcomes model • Use L2 predictor variables to explain variability in parameters with group effects • Remove L2 predictors from equations where they are unable to explain a significant amount of variability