Download

1 / 32
320 likes | 468 Vues
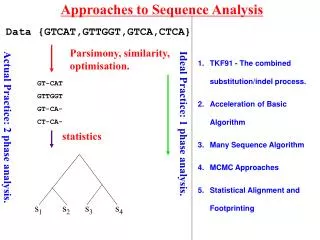
Practical Approaches to Tumor Xenograft Analysis. Frank Voelker, Flagship Biosciences LLC Trevor Johnson, Flagship Biosciences LLC Veronica Traviglone, Infinity Pharmaceuticals Igor Deyneko, Infinity Pharmaceuticals. Outline. Introduction Anatomy of a Xenograft

E N D
Practical Approaches to Tumor Xenograft Analysis • Frank Voelker, Flagship Biosciences LLC • Trevor Johnson, Flagship Biosciences LLC • Veronica Traviglone, Infinity Pharmaceuticals • Igor Deyneko, Infinity Pharmaceuticals
Outline Introduction Anatomy of a Xenograft Defining the Approach to the Analysis Analytical Strategies Examples of Cases Presenting FACTS for Target Tissue Analysis
General Anatomy of a Xenograft CD-31 Stain for Microvessels
Chronic Inflammation and Peripheral Adipose Tissue Adjacent tissue frequently contains host responses such as inflammation, adipose tissue or adnexal structures that need to be excluded from the analysis
Extensive Necrosis and Degeneration CD31 Immunostain Necrosis and neoplastic cells in various stages of degeneration are common features of a xenograft.
Host Response of Vascular Ingrowth Demonstrated with CD31 Immunostain Even the smallest microvessels may be enclosed in adventitial tissue as an extension of stromal ingrowths
Compare H&E and IHC Stains H&E CD31
Compare Corresponding Areas of H&E and CD31 Stains H&E CD31 Compare microscopic characteristics of an H&E- stained section with comparable regions of an IHC CD31-stained section This will provide valuable perspective regarding IHC target tissue staining and will allow more accurate identification of tissue classes.
Significant Xenograft Tissue Components • Neoplastic Cells • Tissue Biomarker • Connective Tissue Stroma • Necrosis and Degeneration • Cystic or Secretory Vacuoles • Artifactual Space Which of these do you want to include in your analysis?
Some Examples of Analytical Endpoints Neoplastic Cell Area Total Xenograft Area A function of neoplastic cell abundance versus necrosis and/or stromal prominence Marker Area or Score Neoplastic Cell Area Immunohistochemistry expression of marker metabolism within neoplastic cell population Number of Neoplastic Nuclei Neoplastic Cell Area An indication of mean neoplastic cell size Targeted Cell Number Total Xenograft Area Cell frequency within measured area Number of Microvessels Neoplastic Cell + Stromal Area Microvessel analysis
What aspects of a marker determine treatment effect? Staining variation in tumors or other tissues frequently raises the question of whether to measure either percent area or average intensity of an immunostain. In some cases, a solution to this problem is to measure score as an output convention encompassing both percent area and stain intensity. (Nwp/Ntotal)x(100) + Np/Ntotal)x(200) + Nsp/Ntotal)x(300) = “H Score” (For a maximum of 300)
Manual Use of Positive and Negative Pen Tools Similar IHC staining of fibronectin and secretion droplets in this xenograft tumor with subsequent poor differentiation by the Genie™ classifier required the use of the negative pen tool to assist in quantitating fibronectin using the IHC deconvolution algorithm.
Manual Use of Positive and Negative Pen Tools Use of a 21UX Cintiq Wacom drawing board facilitates the use of positive and negative pen tools in manually delineating critical features of the xenograft.
Using Genie™ to Segregate Neoplasm from Nontarget Tissue in a Xenograft Stained for Phospho-Histone 3 Central regions of the xenograft contain an interdigitating pattern of necrosis and connective tissue trabeculae too complex for manual exclusion . Accurate segregation of neoplasm (green) from necrosis and connective tissue (red) was accomplished using Genie™
The Rationale Behind Histology Feature Recognition Using software to preprocess an image with the purpose of segregating target tissue components from nontarget tissue. Aperio Genie™ Subsequent analysis yields accurate data only from the target tissue component, and omits erroneous nonspecific results from nontarget tissue. Visiopharm Feature recognition is valuable in xenograft analysis when target and nontarget regions are too intricately interwoven for manual exclusion.
Strategy for Analyzing Successive Samples Xenograft neoplasms within a study are surprisingly heterogeneous even though derived from the same source, and it is difficult and time consuming to derive a common pattern recognition classifier appropriate for all neoplasms within a study. It is more expeditious and also yields more accuracy to develop new classifiers as the analysis progresses. Progression of analysis through sample series * * * Red = 1st Classifier Blue = 2nd Classifier Green = 3rd Classifier * = Points when a new classifier was developed during the analysis
Consistent Analysis of Study Samples Using Genie™ Even though multiple classifiers are constructed for successive samples, the final analyses of target tissue components will be accurate and comparable if the same algorithm threshold values are constantly maintained. Subsequent Uniform Analysis of Segregated Target Tissue for area/intensity
Using Genie™ to Segregate Neoplasm from Nontarget Tissue in a Xenograft Stained for Phospho-Histone 3 Higher magnification reveals accurate separation of target from nontarget tissue. The grayed-out nontarget tissue class consists of a mixture of connective tissue trabeculae and necrotic tumor cells.
Assessing Fibronectin in a Xenograft Using Several Software Programs Original IHC Image Assessing the intensity and quantity of fibronectin as a marker in xenograft stroma Aperio Deconvolution Mark-up Visiopharm Mark-up
Assessing Angiogenesis in a Xenograft Using Several Software Programs Original CD31-Stained Image Use of the microvessel analysis algorithm to assess angiogenesis in a xenograft neoplasm in a mouse Aperio Microvessel Algorithm Mark-up Visiopharm Mark-up Microvessel analysis provides important information regarding potential antineoplastic effects of pharmaceutical compounds
Using the Microvessel Analysis Algorithm to Count Cyclin B1-Positive Target Cells in a Xenograft Use of the microvessel analysis algorithm to assess macrophage populations in mouse xenograft neoplasms Threshold algorithm parameters are modified to accommodate the smaller size and shape characteristics of the cells
Use of Visiopharm™ Software to Analyze a Marker Separately in Cytoplasm and Nuclei of a Neoplasm Discriminating between nuclear and cytoplasmic regions of a neoplasm allows separate biomarker intensity measurement for both nuclear and cytoplasmic markers (analysis with Visiopharm software).
Distinctive or Special Staining Facilitates Target Tissue Pattern Recognition H&E H&E Classifier First pass accuracy is much greater for the H&E-stained section than for the hematoxylin- counterstained IHC section CD31 CD31 Classifier Current histology pattern recognition programs often have difficulty distinguishing target tissue profiles because of low contrast /nonspecific counterstaining
Feature Analysis on Consecutive Tissue Sections (FACTS) • Consecutive • tissue • sectioning 2. Automated feature recognition 3. Image and ROI registration 4. QC and pathologist review
Image and ROI Registration 3. Image and ROI registration • Register images with <3% Feature Error Across multiple consecutive slides • Not a trivial problem given the potential histological and biological differences between tissue sections and stains • Several registration techniques currently used throughout CT/MRI, CT/PET, CT radiology, ultrasound, and multispectral imaging • Typically elastic, morphing, because of image warping • Heavy use of image features or fiducials • Type of registration for best performance in FFPE tissue is heavily dependent on the application
Typical Image Registration Process • Feature detection • Distinctive objects to be aligned • Feature matching • Finding the association between the distinct objects • Transform model estimation • The mapping functions used to align the subsequent image to the reference image • May be non-elastic (much simpler) or elastic • Image re-sampling and transformation • Applying the mapping functions where non-integer coordinates can be correctly interpolated
Non-Elastic Image to Image Registration • Perform color deconvolution to focus on a common Stain, typically Hematoxylin • Helps reduce potential errors from strongly stained “positive” features • Use slide features and image intensities to adjust rotation and translation of selected images or regions u(x,y) -> v(x,y) Rotation: x’ = x•cos(θ) - y•sin(θ) y’ = x•sin(θ) + y•cos(θ) Translation: x -> x’ y -> y’
Annotated Feature to Feature Registration • More complex due to biological and histological differences between serial sections • Usually Elastic to count for these differences • Important to note that the actual images are never morphed, just the annotations • Let the application determine the method Phase Registration: ℮xp(2 ∏ i (u x’ + v y’)) = ƒ(f) ƒ(g) / | ƒ(f) ƒ(g) | Mutual Information: MI(X,Y) = H(Y) – H(Y | X) = H(X) – H(Y) – H(X,Y) where H(X) = Ex(log(P(X))
Annotation Feature to Feature Registration (cont.) Wavelet Transform: Decompose image into collection of appropriate wavelet (Spline, Haar, Etc.) Filter image along rows and columns (high and low pass) Find frequency coefficients and apply differential measurements
Acknowledgments • Dr. Steven Potts, Flagship Biosciences LLC • Dr. David Young, Flagship Biosciences LLC • Ms. Charlotte Aagaard Johnson, Visiopharm Inc. • Mr. Rob Diller, Flagship Biosciences LLC • Mr Erik Hagendorn, Flagship Biosciences LLC Questions? Email contact: frank@flagshipbio.com trevor@flagshipbio.com