SURVIVORSHIP LAB
80 likes | 222 Vues
This guide provides a comprehensive framework for analyzing cemetery data by transferring recorded deaths and surviving individuals into specific master sheets based on gender and century. Users will carefully input data into columns that track the number of deaths and the remaining population, assess mortality rates, and calculate survival fractions for various age cohorts. The ultimate goal is to visualize these findings through survivorship curves, highlighting the trends in mortality and survival rates across different demographics.

SURVIVORSHIP LAB
E N D
Presentation Transcript
SURVIVORSHIP LAB October 24, 2013
Each pair of you will transfer your data to a master sheet There are six master sheets; one for each gender and century – be sure to transfer your data to the correct sheets! The number of deaths you recorded in each cohort is written in the 2nd column of the master sheet
Completing the Third column of the Master Sheet Top of third column – number surviving at beginning of cohort: • This value is the total in the population; if there were 27 males TOTAL counted in the 18th century, the first cell = 27 • 2nd cell in third column – number remaining after deaths in 0 – 4.9 cohort: • If 2 males died between 0 – 5 years of age, subtract 2 from 27; the value in the 2nd cell would = 25 • Continue completing the remainder of the third column
Completing the Fourth Column of the Master Sheet • The first cell (0 – 4.9) = 1.00 • This is the fraction of the number surviving at birth; in other words, everyone in the cemetery was alive, at least for a little while… • The 2nd cell = the total in the population / the number who survived in the 5 – 9.9 cohort • The 3rd cell = the total in the population / the number who survived in the 10 – 14.9 cohort • Total in the population is one value, used for the entire population, i.e. 18th century males
Completing the Fifth Column of the Master Sheet • This is the MORTALITY RATE • Number dying during cohort / number surviving at beginning of cohort • Column 2 / column 3 at each cohort • This can be expressed as a decimal, or as a percentage Example: if there were 27 males and 2 died in the 0 – 4.9 cohort, then 2/27 = 0.074 or 7.4%
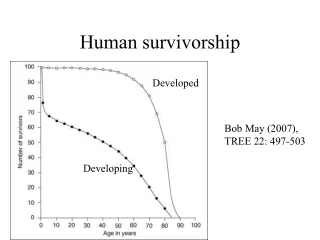
Drawing a Survivorship Curve • X – axis = cohort (first column) • Y – axis = number surviving at beginning of cohort (third column) Draw survivorship curves for each of the 6 populations!