Download

1 / 11
150 likes | 499 Vues
Survivorship Curves. Application: The Cemetery Lab St. James Cemetery, Toronto ON. What is survivorship?. D escribe s the pattern of mortality and survival in a population The probability of newborn individuals of a cohort surviving to particular ages. Discuss with a partner.

E N D
Survivorship Curves Application: The Cemetery Lab St. James Cemetery, Toronto ON
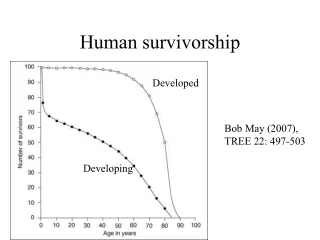
What is survivorship? • Describes the pattern of mortality and survival in a population • The probability of newborn individuals of a cohort surviving to particular ages
Discuss with a partner • What are the different types of survivorship curves?
Three types of Survivorship Curves - • Type I survivorship curves are for species that have a high survival rate of the young, live out most of their expected life span and die in old age. • Humans are a good example of a species with a Type I survivorship curve. Q: What is the catch? • Type II survivorship curves are for species that have a relatively constant death rate throughout their life span. Death could be due to hunting or diseases. • Examples of species exhibiting a Type II survivorship curve are coral, squirrels, honey bees and many reptiles. • Type III survivorship curves are found in species that have many young, most of which die very early in their life. Plants, oysters and sea urchins are examples of species that have Type III survivorship curves.
Our data from St. James Cemetery • Combine 100 birth and death dates • Construct Survivorship Curve as per instructions in the Tiger Book
Back at the lab- calculate survivorship (in this example n=22) Survivorship = No. of original group surviving *1000 original number (n)
Part 2: Simpson’s diversity index • At the cemetery, collect 100 leaves • Sort them based on their species type • Count the number of each species • Calculate the diversity index for the cemetery (see handout) • Collect 100 leaves at another location and calculate the index • Compare the 2 values. Which location is more diverse?