Survivorship Curves
This article by Andréa Ratti, Natalie Saint, and Hannah Gunn explores survivorship curves and their relationship to population density and dispersion patterns. It delves into demographic analysis, focusing on vital statistics of populations and how they evolve over time. The study outlines how to construct life tables, track age-specific survival rates, and identify gender-related mortality trends. Different types of survivorship curves—Type I, Type II, and Type III—are analyzed, illustrating the varying death rates across species and their implications for ecological strategies.

Survivorship Curves
E N D
Presentation Transcript
By: Andréa Ratti, Natalie Saint, and Hannah Gunn Survivorship Curves
Factors that influence population density and dispersion patterns. Demography: the study of vital statistics of populations and how they change over time. Demographics
A way of summarizing the vital statistics of a population Age specific summaries of the survival pattern of a population In order to create a life table a population ecologist must follow a cohort, a group of individuals that are of the same age, from birth until all are dead. Life Tables
Ecologists must record the number of individuals that die in each age group and then calculate the proportion that survive from one age to the next Life tables reveal proportions of males to females in each cohort alive at each age, or which gender has higher death rates.
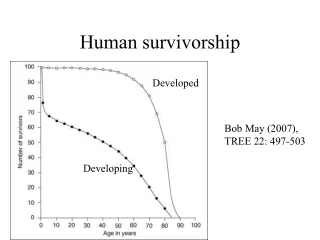
A graph that represents that data in a life table by plotting the proportion of the cohort alive at each age. Survivorship Curves
Type I: curve is flat at the start, which represents low death rates during early and middle life, then drops when death rates increase later in life. These are normally large mammals that produce offspring and provide good care for them. Ex: Humans, elephants, and rhinos. Idealized Curves
Type II: Constant death rates through the entire life span. Resulting in a straight line. This normally occurs in some rodents, some lizards, and some annual plants. Ex: Belding’s Ground Squirrels Type II
Type III: Drops sharply at the beginning of life due to high death rates at a young age, this could be due to factors like predation, but flattens out as death rates decline for the few individuals that survive the early period. This normally occurs in organisms that produce high levels of offspring and take little to no-care of them. Ex: Long-lived plants, most marine invertebrates Type III