Reasoning in Psychology Using Statistics
370 likes | 393 Vues
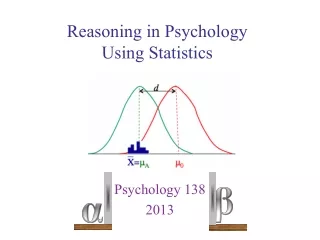
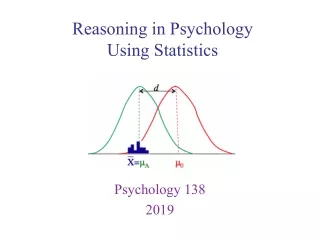
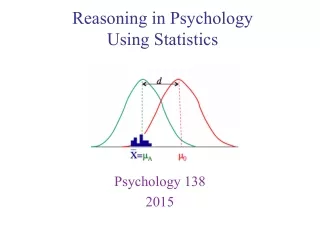
Reasoning in Psychology Using Statistics. Psychology 138 2015. Don ’ t forget Quiz 1, due Friday, Jan. 23rd Exam 1 not far away, Wed Feb 4 th. Announcements. Scientific Method Ask research question Identify variables and formulate hypothesis Define population Select research methodology

Reasoning in Psychology Using Statistics
E N D
Presentation Transcript
Reasoning in PsychologyUsing Statistics Psychology 138 2015
Don’t forget Quiz 1, due Friday, Jan. 23rd • Exam 1 not far away, Wed Feb 4th Announcements
Scientific Method • Ask research question • Identify variables and formulate hypothesis • Define population • Select research methodology • Collect data from sample • Analyze data • Draw conclusions based on data • Repeat • Where do the data come from? • Experiments method • Independent variables • Dependent variables • Observational method • Explanatory variables • Response variables From last time
Observational (correlational) study • Observe & measurevariables of interest to find relationships • No attempt to manipulate or influence responses • Experimental methodology • Independent variable manipulatedwhile changes observed & measured in another variable (dependent) • Can establish cause-and-effect relationships • Extensive controls to minimize extraneous sources of variability • Quasi-experimental methodology • Independent variable a pre-existing characteristic (e.g., sex, age, etc.) • Groups to compare, but don’t know relevant psychological variable Basic Research Methods
Observational (correlational) study • Observe & measure variables of interest to find relationships • No attempt to manipulate or influence responses • Experimental methodology • Independent variable manipulated while changes observed & measured in another variable (dependent) • Can establish cause-and-effect relationships • Extensive controls to minimize extraneous sources of variability • Quasi-experimental methodology • Independent variable a pre-existing characteristic (e.g., sex, age, etc.) • Groups to compare, but don’t know relevant psychological variable Basic Research Methods
Response (dependent) variable Explanatory (independent) variable Claim: Absence makes the heart grow fonder • What are the variables in this claim? Measuring and Manipulating Variables
Claim: Absence makes the heart grow fonder What do we mean by absence? Two people involved in relationship having to be apart for a long time. How do we measure (or manipulate)absence? Amount of time apart, number of visits, distance one of these or perhaps a combination Measuring and Manipulating Variables
Claim: Absence makes the heart grow fonder So what do we mean by heart grow fonder? • Strength of relationship • Level of desire How do we measurefondness of the heart? • Have couple rate fondness for one another • Hook each to brain monitor & record while seeing pictures of sweetheart & pictures of other people Measuring and Manipulating Variables
Operational definition • Specifies relationship between conceptual & operational levels • Two levels of variables • Conceptual level of variables • What theory is about (absence, fondness) • Operational level of variables • What actually manipulated/measured in research • Duration of time apart • Rated fondness Measuring and Manipulating Variables
Operational definition • Specifies relationship between conceptual & operational levels • Describes set of operations or procedures for measuring conceptual variable • Defines variable in terms of measurement Measuring and Manipulating Variables
Brainwave machine Survey • How to measure a variable? • Instrument: Tool to measure dependent variable • e.g., fondness • How might these measures be different? What impact might these differences have? Measurement: Quantitative Research
Two properties of measurement • Unit of measurement - minimum sized unit • Scale of measurement - correspondence between properties of numbers &variables measured • Error in measurement Measurement: Quantitative Research
Two properties of measurement: • Unit of measurement - minimum sized unit • Scale of measurement - correspondence between properties of numbers &variables measured • Error in measurement Measurement: Quantitative Research
3, or 2.5 cookies 2, 1 kid or 2 kids , but not 2.5 • Continuous variables • Variables can take any number & be infinitely broken down into smaller & smaller units • E.g., For lunch I can have • Discrete variables • Broken into a finite number of discrete categories that can’t be broken down • E.g., In my family I can have Units of Measurement
Two properties of measurement: • Unit of measurement - minimum sized unit • Scale of measurement - correspondence between properties of numbers &variables measured Measurement
Categorical variables • Quantitative variables • Set of categories • Distinct levels with differing amounts of characteristic of interest • Can attach numbers to these amounts Scales of measurement
Categorical variables • Nominal scale Scales of measurement
brown, hazel blue, green, • Nominal Scale: Consists of a set of categories that have different names. • Measurements on a nominal scale label and categorize observations, but do not make any quantitative distinctions between observations. • Example: • Eye color: Scales of measurement
Categorical variables • Nominal scale • Ordinal scale Scales of measurement
Small, Med, Lrg, XL, XXL • Ordinal Scale: Consists of a set of categories that are organized in an ordered sequence. • Measurements on an ordinal scale rank observations in terms of size or magnitude. • Example: • T-shirt size: Scales of measurement
Categorical variables • Nominal scale • Ordinal scale • Quantitative variables • Interval scale Scales of measurement
Interval Scale: Consists of ordered categories where all of the categories are intervals of exactly the same size. • With an interval scale, equal differences between numbers on the scale reflect equal differences in magnitude. • Ratios of magnitudes are not meaningful. • Example: • Fahrenheit temperature scale 40º 20º “Not Twice as hot” Scales of measurement
Ratio scale: An interval scale with the additional feature of an absolute zero point. • With a ratio scale, ratios of numbers DO reflect ratios of magnitude. • It is easy to get ratio and interval scales confused • Consider the following example: Measuring your height with playing cards Scales of measurement
Ratio scale 8 cards high Scales of measurement
Interval scale 5 cards high Scales of measurement
Ratio scale Interval scale 8 cards high 5 cards high 0 cards high means ‘as tall as the table’ 0 cards high means ‘no height’ Scales of measurement
Ratio scale Interval scale 8 cards high 5 cards high Rescale: 0 = Mean Ht = X - M 0 cards high means ‘as tall as the table’ 0 cards high means ‘no height’ Scales of measurement
Two properties of measurement: • Unit of measurement - minimum sized unit • Scale of measurement - correspondence between properties of numbers &variables measured • Error in measurement Measurement: Quantitative Research
Validity • Does our measure really measure the construct? • Is there bias in our measurement? • Reliability • Do we get the same score with repeated measurements? Errors in measurement
Center represents the true score Collection of ‘darts’ is a sample of measurements The center of the sample is the estimate of the true score Dart board represents Population of all possible scores Dart board example
Low variability/low bias Points are all close together (similar) & Centered on the target Reliable & valid measure Dart board example
Low variability/high bias Points are all close together (similar) & NOT centered on the target Reliable but invalid measure Dart board example
High variability/low bias Points are NOT all close together (dissimilar) & Centered on the target Valid but unreliable measure Dart board example
High variability/high bias Points are NOT all close together (dissimilar) & NOT centered on the target Unreliable & invalid measure Dart board example
Today’s lab: Measurement • Questions? SPSS Wrap up