Download
1 / 61
620 likes | 702 Vues
Explore Pace University's progress and trends in student engagement over the past decade, with a focus on academic challenges and collaborative learning. Key insights and comparisons provided for both first-year and senior students.

E N D
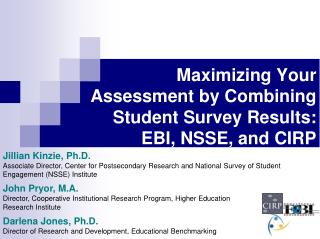
Ten Years of NSSE Results:Where have we beenWhere are we nowWhere must we go Barbara Pennipede Assistant Vice President Planning, Assessment and Institutional Research The Tenth Anniversary Pace University Faculty Institute May 24, 2011
Five Measures of College Student Engagement: The Benchmarks Level of Academic Challenge Active and Collaborative Learning Student-Faculty Interaction Enriching Educational Experiences Supportive Campus Environment
Seven Principles of Good Practice in Undergraduate Education Student-faculty contact Cooperation among students Active learning Prompt feedback Time on task High Expectations Respect for diverse talents and ways of learning Chickering and Gamson, 1987
What Really Matters in College: Engagement “The Research is unequivocal: students who are actively involved in both academic and out-of-class activities gain more from the college experience than those who are not so involved.” Ernest T. Pascarella & Patrick T. Terenzini, How College Affects Students
The National Survey of Student Engagement Critical Assumption: The frequency with which students engage in activities that represent effective educational practice is a good proxy for collegiate quality.
How Has Pace Performed on the Benchmarks Over Time? Level of Academic Challenge First-year students? Senior students?
Level of Academic ChallengeActivities and Conditions Number of assigned textbooks, books, book-length packs of course readings Number of written papers or reports of 20 pages or more Number of written papers or reports between 5 and 19 pages Number of written papers or reports of fewer than 5 pages
Level of Academic ChallengeActivities and Conditions Analyzing the basic elements of an idea Synthesizing and organizing ideas, information, or experiences into new, more complex interpretations and relationships Making judgments about the value of information, arguments, or methods Applying theories or concepts to practical problems or new situations
Level of Academic ChallengeFirst-Year StudentsInternal Pace Comparison There is no significant change in this benchmark between 2002 and 2010 for First-year students Synthesizing ideas and concepts is the only significant change in the activities or conditions in this benchmark. (Positive at .01 level) There is a significant negative change between 2003 NSSE results (2002 Cohort) and 2004 NSSE results (2003 Cohort)
Level of Academic ChallengeFirst-Year Students – Peer Comparisons Pace University Peer Comparisons • 2002 Benchmark Score • Carnegie Peers 52.3 • 2009 Benchmark Score • 53.2 • 2010 Benchmark Scores • Carnegie Peers 55.1 • Institutional Benchmarks 57.7 Negative difference at .001 level • 2002 Benchmark Score • 52.6 • 2009 Benchmark Score • 55.3 = Top 50% • 2010 Benchmark Score • 54.5
Level of Academic ChallengeSenior StudentsInternal Pace Comparison There is a significant increase in score between 2002 (51.6) and 2010 (57.6). The score begins to change with the 2004 NSSE results (55.0) The 2008 results (56.1) are significantly improved over 2002 and the results have remained in this range There are significant changes in the activities and/or conditions for this benchmark
Level of Academic ChallengeSignificant internal changes for seniors All of the following activities and/or conditions are significant increases compared to 2002 responses: Integrated ideas in a paper/project p<.05 Put together ideas from different classes p<.001 Worked harder than thought you could to meet expectations p<.001 Synthesizing and organizing ideas p<.05 Making judgments p<.05
Level of Academic ChallengeSignificant internal changes for seniors All of the following activities and/or conditions are significant increases compared to 2002 responses: Written papers between 5 and 19 pages p<.001 Preparing for class p<.05 Solving complex real-world problems p<.05 Spending significant time on studying p<.05 Applying theories/concepts to problems p<.01
Level of Academic ChallengeSignificant internal changes for seniors All of the following activities and/or conditions are significant increases compared to 2002 responses: Writingclearly and effectively p<.05 Speaking clearly and effectively p<.05 Thinking critically and analytically p<.05
Level of Academic ChallengeSenior Students – Peer Comparisons Pace University Peer Comparisons • 2002 Benchmark Score • 51.6 • 2010 Benchmark Score • 57.6 • 2002 Benchmark Score • Carnegie Peers 53.3 • 2010 Benchmark Scores • Carnegie Peers 59.0 • Institutional Benchmarks 59.4 Negative difference at .05 level
Active and Collaborative LearningActivities Asked questions in class or contributed to class discussions Made a class presentation Worked with other students during class Worked with other students outside of class Tutored or taught other students Community-based project as part of course Discussed class readings/ideas outside of class
Active and Collaborative LearningFirst-Year StudentsInternal Pace Comparison There is no significant change in this benchmark between 2002 and 2010 for First-year students There are significant changes in the activities for this benchmark -Asked questions in class – p< .01 - Community-based project in course – p< .01 level -Made a class presentation – p< .05 level
Active and Collaborative LearningFirst-Year Students – Peer Comparisons Pace University Peer Comparisons • 2002 Benchmark Score • 40.9 • 2010 Benchmark Score • 45.7 • 2002 Benchmark Score • Carnegie Peers 39.4 • 2010 Benchmark Scores • Carnegie Peers 44.5 • Institutional Benchmarks 46.1
Active and Collaborative LearningSenior StudentsInternal Pace Comparison There is a significant increase in scores between 2002 (43.4) and 2010 (52.8). The score changes significantly with the 2004 NSSE results (50.5) and they remain in this range There are significant internal changes in the activities for this benchmark The significant improvement is identified by NSSE and Pace is invited to be part of the Learning to Improve Study
Active and Collaborative LearningSignificant internal changes for seniors All of the following activities and/or conditions are significant increases compared to 2002 responses: Asked questions in class p<.01 Worked with classmates outside of class p<.05 Community-based project part of class p<.001 Discussed class readings/ideas outside of class p<.01 Contributing to the welfare of your community p<.001
Active and Collaborative LearningSenior Students – Peer Comparisons Pace University Peer Comparisons • 2002 Benchmark Score • 43.4 • 2007 Benchmark Score • 53.7= Top 50%; p<.05 • 2010 Benchmark Score • 52.8 • 2002 Benchmark Score • Carnegie Peers 47.2 • 2007 Benchmark Score • Carnegie Peers 51.7 • 2010 Benchmark Scores • Carnegie Peers 52.8 • Institutional Benchmarks 52.5
Student Faculty InteractionActivities Discussed grades or assignments with an instructor Talked about career plans with a faculty member or advisor Discussed ideas from your readings or classes with faculty members outside of class Worked with faculty members on activities other than coursework Received prompt written or oral feedback Worked with a faculty member on a research project
Student Faculty InteractionFirst-year StudentsPace Internal Comparison There is a significant difference between the 2002 score (35.2) and the 2010 score (42.1) In 2008, there is a significant increase in this benchmark score (44.6) compared to 2002 (35.2) through 2007 (38.2) Compared to 2002, there are only two activities that have increased significantly: talking about career plans with faculty (p<.05) and working with faculty on activities other than coursework (p<.001)
Student Faculty InteractionFirst-year Students – Peer Comparisons Pace University Peer Comparisons • 2002 Benchmark Score • 35.2 • 2008 Benchmark Score • 39.2= Top 50%; p<.01 • 2010 Benchmark Score • 42.1 w/o research question • 36.6 with research question • 2002 Benchmark Score • Carnegie Peers 36.8 • 2008 Benchmark Score • Carnegie Peers 35.9 • 2010 Benchmark Scores • Score not available for peers • Carnegie Peers 35.8 • Institutional Benchmarks 36.6
Student Faculty InteractionSenior StudentsPace Internal Comparison There is a significant difference between the 2002 score (34.3) and the 2010 score (47.3) In 2004, there is a significant increase in this benchmark score (41.4) compared to 2002 (34.3) There is another significant change between 2004 (41.4) and 2010 (47.3) Several benchmark activities have increased significantly This is the second improvement identified by NSSE for Learning to Improve
Student Faculty InteractionSeniors – Increased Activities Discussed grades or assignments with an instructor p<.01 Talked about career plans with a faculty member or advisor p<.001 Discussed ideas from your readings or classes with faculty members outside of class p<.001 Worked with faculty members on activities other than coursework p<.01 Received prompt written or oral feedback p<.001
Student Faculty InteractionSenior Students – Peer Comparisons Pace University Peer Comparisons • 2002 Benchmark Score • 34.3 • 2010 Benchmark Score • 47.3 w/o research question • 43.5 with research question • 2002 Benchmark Score • Carnegie Peers 37.3 • 2010 Benchmark Scores • Score not available for peers • Carnegie Peers 43.8 • Institutional Benchmarks 43.8
Enriching Educational ExperiencesActivities and Conditions Talking with students with different religious beliefs, political opinions or values Talking with students of a different race or ethnicity An institutional climate that encourages contact among students from different economic, social, and racial or ethnic backgrounds Using electronic technology to discuss or complete assignments
Enriching Educational ExperiencesActivities and Conditions Participating in: Internships or field experiences Community service or volunteer work Foreign language coursework Study Abroad Independent study or self-assigned major Culminating senior experience Co-curricular activities Learning Communities
Enriching Educational ExperiencesFirst-year Students There are no significant changes between 2002 and 2010 However First-year student responses at Pace have placed Pace in the top 10% category of responses in 2006, 2007, 2008, 2009 and 2010! In 2008, Pace was significantly above the 10% mean p<.05
Enriching Educational ExperiencesFirst-year Student Response Changes Included diverse perspectives in class discussions or assignments p<.001 Used email to communicate with an instructor p<.001 Participating in co-curricular activities Institution contributed to using computing and information technology p<.05 Used an electronic medium to discuss or complete an assignment p<.05
Enriching Educational ExperiencesFirst-year Students – Peer Comparisons Pace University Peer Comparisons • 2004 Benchmark Score • 32.3 • 2010Benchmark Score • 33.8 • Pace significantly higher than Carnegie Peers p<.001 • Pace significantly higher than Institutional Benchmarks p<.01 • 2004 Benchmark Score • Carnegie Peers 25.7 • 2010 Benchmark Scores • Carnegie Peers 28.5 • Institutional Benchmarks 31.4
Enriching Educational ExperiencesSenior Students – Internal Comparisons The 2001-2003 response options are not comparable to 2004 and later years. They were substantially altered. Comparisons can only begin with 2004. There is a significant change between 2004 (40.0) and 2010 (47.5) The 2006 score (45.0) was significantly higher than 2004. There are several significant increases in this benchmark’s activities and conditions
Enriching Educational ExperiencesSenior Student Response Changes Included diverse perspectives in class discussions or assignments p<.001 Used email to communicate with an instructor p<.001 Used an electronic medium to complete an assignment p<.05 Institution contributed to using computing and information technology p<.05 Used electronic technology to discuss or complete assignments p<.05
Enriching Educational ExperiencesSenior Student Response Changes Had serious conversations with students who are very different from you p<.05 Had serious conversations with students of a different race or ethnicity than your own p<.05 Participating in co-curricular activities p<.05 Institution emphasizes attending campus events and activities p<.001
Enriching Educational ExperiencesSenior Student External Comparisons Senior student responses have placed Pace in the top 10% response category in 2007 Senior student responses have placed Pace in thetop 50% response category in 2006, 2008, 2009 and 2010
Enriching Educational ExperiencesSenior Students – Peer Comparisons Pace University Peer Comparisons • 2004 Benchmark Score • 40.0 • 2010Benchmark Score • 47.5 • Pace significantly higher than Carnegie Peers p<.001 • Pace responses similar to Institutional Benchmarks • 2004 Benchmark Score • Carnegie Peers 37.4 • 2010 Benchmark Scores • Carnegie Peers 41.8 • Institutional Benchmarks 45.7
Supportive Campus EnvironmentConditions Campus environment provides support you need to help you succeed academically Campus environment helps you cope with your non-academic responsibilities (work, family, etc.) Campus environment provides the support you need to thrive socially
Supportive Campus EnvironmentConditions Quality of relationships with other students Quality of relationships with faculty members Quality of relationships with administrative personnel and offices
Supportive Campus EnvironmentFirst-year Students – Internal Comparisons There are no significant changes between 2002 and 2010. There is only one 2010 response that is significantly different from 2002: Institution provides the support you need to thrive socially p<.05
Supportive Campus EnvironmentFirst-year Students – Peer Comparisons Pace University Peer Comparisons • 2002 Benchmark Score • 56.8 • 2010 Benchmark Score • 58.1 • 2002 Benchmark Score • Carnegie Peers 57.3 • 2010 Benchmark Scores • Carnegie Peers 62.1 Pace significantly lower than Carnegie Peers p<.001 • Institutional Benchmarks 60.9 Pace significantly lower p<.05